
Page 113 - Introduction to Petroleum Engineering
P. 113
98 MULTIPHASE FLOW
5.4 Capillary pressure decreases when pore radius decreases.
5.5 Welge developed a method to use fractional flow curves to predict oil recovery
from a water flood.
5.6 A well producing from the transition zone between a water zone and a gas
zone will produce both water and oil.
5.7 Wettability is a measure of the ability of a liquid to maintain contact with a
solid surface.
5.8 The value of relative permeability to water k is must be in the range
rw
≤ 0 rw ≤ k 1.0.
5.9 The rate of oil production during a water flood increases after water
breakthrough.
5.10 Mobility ratio is the mobility of the displacing fluid divided by the mobility of
the displaced fluid.
5.7.3 Exercises
5.1 Suppose the effective permeability to air in a core is 200 md for single‐phase flow
of air and the relative permeability to water at 100% water saturation is 0.1. What
is the effective permeability of water in the core at 100% water saturation? Use
the effective permeability to air as the absolute permeability of the core.
5.2 Capillary pressure for a gas–water system p is 10 psia and water‐phase pressure
cgw
p is 2500 psia. If water is the wetting phase, what is the gas‐phase pressure?
w
5.3 A well produces 100 STB/day oil and 1000 STB/day water. What is the
water cut?
5.4 Suppose a well originally produces 10 000 STBO/day at a pressure drawdown
of 10 psia. The well PI declined 5% a year for the first 2 years of production.
What is the well PI at the end of year 2?
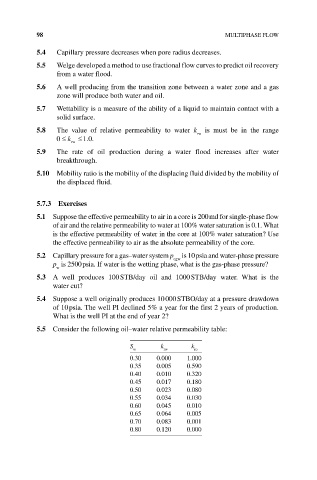
5.5 Consider the following oil–water relative permeability table:
S k k
w rw ro
0.30 0.000 1.000
0.35 0.005 0.590
0.40 0.010 0.320
0.45 0.017 0.180
0.50 0.023 0.080
0.55 0.034 0.030
0.60 0.045 0.010
0.65 0.064 0.005
0.70 0.083 0.001
0.80 0.120 0.000