
Page 110 - Introduction to Petroleum Engineering
P. 110
WELL PRODUCTIVITY 95
1.00
Saturation
0.80
“shock”
Water saturation 0.60
0.40
0.20
0.00
0.00 0.20 0.40 0.60 0.80 1.00
Normalized position
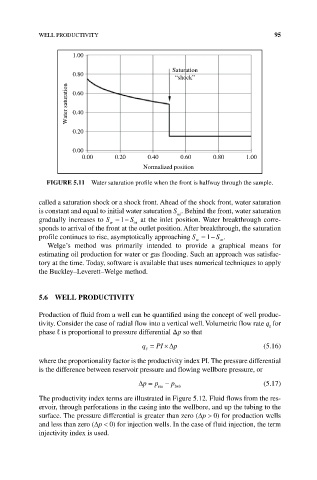
FIgURE 5.11 Water saturation profile when the front is halfway through the sample.
called a saturation shock or a shock front. Ahead of the shock front, water saturation
is constant and equal to initial water saturation S . Behind the front, water saturation
wi
gradually increases to S =− S at the inlet position. Water breakthrough corre-
1
w
or
sponds to arrival of the front at the outlet position. After breakthrough, the saturation
profile continues to rise, asymptotically approaching S =− S .
1
or
w
Welge’s method was primarily intended to provide a graphical means for
estimating oil production for water or gas flooding. Such an approach was satisfac-
tory at the time. Today, software is available that uses numerical techniques to apply
the Buckley–Leverett–Welge method.
5.6 WELL PRODUCTIVITY
Production of fluid from a well can be quantified using the concept of well produc-
tivity. Consider the case of radial flow into a vertical well. Volumetric flow rate q for
ℓ
phase ℓ is proportional to pressure differential Δp so that
q = PI ×∆ p (5.16)
where the proportionality factor is the productivity index PI. The pressure differential
is the difference between reservoir pressure and flowing wellbore pressure, or
∆p = p − p fwb (5.17)
res
The productivity index terms are illustrated in Figure 5.12. Fluid flows from the res-
ervoir, through perforations in the casing into the wellbore, and up the tubing to the
surface. The pressure differential is greater than zero (∆p > 0) for production wells
and less than zero (∆p < 0) for injection wells. In the case of fluid injection, the term
injectivity index is used.