
Page 107 - Introduction to Petroleum Engineering
P. 107
92 MULTIPHASE FLOW
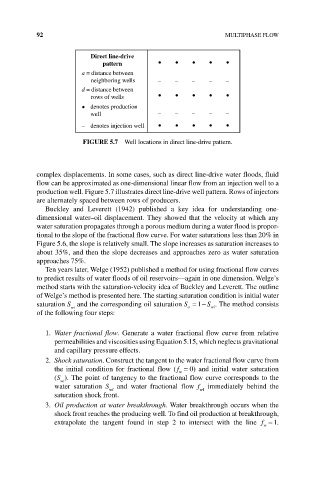
Direct line-drive
pattern • • • • •
a = distance between
neighboring wells _ _ _ _ _
d = distance between
rows of wells • • • • •
• denotes production _ _ _ _ _
well
_ denotes injection well • • • • •
FIgURE 5.7 Well locations in direct line‐drive pattern.
complex displacements. In some cases, such as direct line‐drive water floods, fluid
flow can be approximated as one‐dimensional linear flow from an injection well to a
production well. Figure 5.7 illustrates direct line‐drive well pattern. Rows of injectors
are alternately spaced between rows of producers.
Buckley and Leverett (1942) published a key idea for understanding one‐
dimensional water–oil displacement. They showed that the velocity at which any
water saturation propagates through a porous medium during a water flood is propor-
tional to the slope of the fractional flow curve. For water saturations less than 20% in
Figure 5.6, the slope is relatively small. The slope increases as saturation increases to
about 35%, and then the slope decreases and approaches zero as water saturation
approaches 75%.
Ten years later, Welge (1952) published a method for using fractional flow curves
to predict results of water floods of oil reservoirs—again in one dimension. Welge’s
method starts with the saturation‐velocity idea of Buckley and Leverett. The outline
of Welge’s method is presented here. The starting saturation condition is initial water
saturation S and the corresponding oil saturation S =− S . The method consists
1
wi
wi
o
of the following four steps:
1. Water fractional flow. Generate a water fractional flow curve from relative
permeabilities and viscosities using Equation 5.15, which neglects gravitational
and capillary pressure effects.
2. Shock saturation. Construct the tangent to the water fractional flow curve from
the initial condition for fractional flow (f = 0) and initial water saturation
w
(S ). The point of tangency to the fractional flow curve corresponds to the
wi
water saturation S and water fractional flow f immediately behind the
wf
wf
saturation shock front.
3. Oil production at water breakthrough. Water breakthrough occurs when the
shock front reaches the producing well. To find oil production at breakthrough,
extrapolate the tangent found in step 2 to intersect with the line f = 1.
w