
Page 109 - Introduction to Petroleum Engineering
P. 109
94 MULTIPHASE FLOW
1.0
f w = 0.93
0.8 S w,ave = 0.64
Water fractional
ow 0.6 S w = 0.58
0.4
0.2
0.0
0.0 0.2 0.4 0.6 0.8 1.0
Water saturation
FIgURE 5.9 Application of Welge’s step 4 to the fractional flow curve of Figure 5.6.
0.60
Water breakthrough
0.50
Oil produced, pore volumes 0.40
0.30
0.20
0.10
0.00
0.00 0.20 0.40 0.60 0.80 1.00 1.20
Water injected, pore volumes
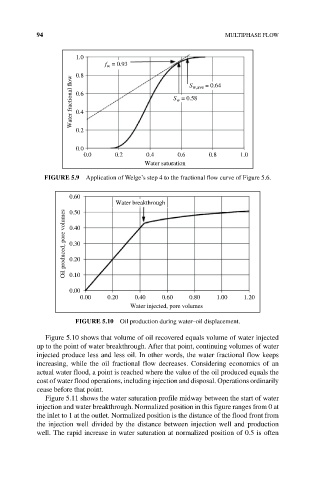
FIgURE 5.10 Oil production during water–oil displacement.
Figure 5.10 shows that volume of oil recovered equals volume of water injected
up to the point of water breakthrough. After that point, continuing volumes of water
injected produce less and less oil. In other words, the water fractional flow keeps
increasing, while the oil fractional flow decreases. Considering economics of an
actual water flood, a point is reached where the value of the oil produced equals the
cost of water flood operations, including injection and disposal. Operations ordinarily
cease before that point.
Figure 5.11 shows the water saturation profile midway between the start of water
injection and water breakthrough. Normalized position in this figure ranges from 0 at
the inlet to 1 at the outlet. Normalized position is the distance of the flood front from
the injection well divided by the distance between injection well and production
well. The rapid increase in water saturation at normalized position of 0.5 is often