
Page 104 - Introduction to Petroleum Engineering
P. 104
RELATIVE PERMEABILITY 89
1.00
0.80
Water, oil relative permeabilities 0.60
0.40
0.20
0.00
0.00 0.20 0.40 0.60 0.80 1.00
Water saturation
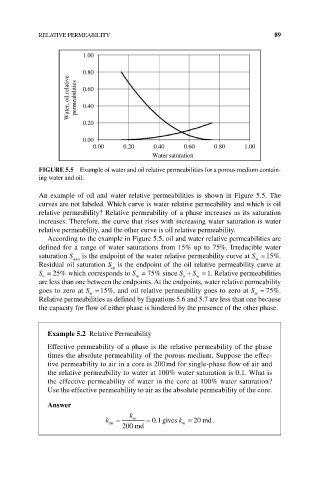
FIgURE 5.5 Example of water and oil relative permeabilities for a porous medium contain-
ing water and oil.
An example of oil and water relative permeabilities is shown in Figure 5.5. The
curves are not labeled. Which curve is water relative permeability and which is oil
relative permeability? Relative permeability of a phase increases as its saturation
increases. Therefore, the curve that rises with increasing water saturation is water
relative permeability, and the other curve is oil relative permeability.
According to the example in Figure 5.5, oil and water relative permeabilities are
defined for a range of water saturations from 15% up to 75%. Irreducible water
saturation S is the endpoint of the water relative permeability curve at S = 15%.
wirr
w
Residual oil saturation S is the endpoint of the oil relative permeability curve at
or
S = 25% which corresponds to S = 75% since S + S = 1. Relative permeabilities
o
w
o
w
are less than one between the endpoints. At the endpoints, water relative permeability
goes to zero at S = 15%, and oil relative permeability goes to zero at S = 75%.
w
w
Relative permeabilities as defined by Equations 5.6 and 5.7 are less than one because
the capacity for flow of either phase is hindered by the presence of the other phase.
Example 5.2 Relative Permeability
Effective permeability of a phase is the relative permeability of the phase
times the absolute permeability of the porous medium. Suppose the effec-
tive permeability to air in a core is 200 md for single‐phase flow of air and
the relative permeability to water at 100% water saturation is 0.1. What is
the effective permeability of water in the core at 100% water saturation?
Use the effective permeability to air as the absolute permeability of the core.
Answer
k
k = w = 01. gives k = 20 md.
rw w
200 md