
Page 211 - Introduction to Petroleum Engineering
P. 211
198 WELL COMPLETIONS
14
R=1.0
0.9
12 0.8
0.7
0.6
Modified productivity index ratio 8 6 0.5
10
0.4
0.3
0.2
4
0.1
2
0
100 1000 10 000 100 000 1 000 000
Relative conductivity
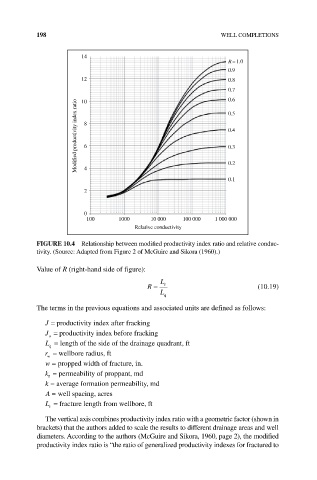
FIGURE 10.4 Relationship between modified productivity index ratio and relative conduc-
tivity. (Source: Adapted from Figure 2 of McGuire and Sikora (1960).)
Value of R (right‐hand side of figure):
L
R = f (10.19)
L q
The terms in the previous equations and associated units are defined as follows:
J = productivity index after fracking
J = productivity index before fracking
o
L = length of the side of the drainage quadrant, ft
q
r = wellbore radius, ft
w
w = propped width of fracture, in.
k = permeability of proppant, md
f
k = average formation permeability, md
A = well spacing, acres
L = fracture length from wellbore, ft
f
The vertical axis combines productivity index ratio with a geometric factor (shown in
brackets) that the authors added to scale the results to different drainage areas and well
diameters. According to the authors (McGuire and Sikora, 1960, page 2), the modified
productivity index ratio is “the ratio of generalized productivity indexes for fractured to