
Page 210 - Introduction to Petroleum Engineering
P. 210
HYDRAULIC FRACTURING 197
(
σ =σ =1908 psi + 095 4500 psi) = 6183 psi
.
hmin h
σ hmax = 6183 psi + 2000 psi = 8183 psi
During the fracking process, pressure measurements at the wellhead can provide
feedback on the above estimates of stress. One pressure value that may be observed
during preliminary stages of fracking is the frack closure pressure. It appears on the
pressure–time plot as a quick change of slope. The frack closure pressure is key to
selecting the type of proppant for a fracture. If the closure pressure exceeds the
strength of the proppant, the proppant will be crushed, and the benefit of the fracture
can be entirely lost. And if the proppant is sufficiently strong to prevent crushing,
embedment of proppant particles in the walls of the formation will reduce the fracture
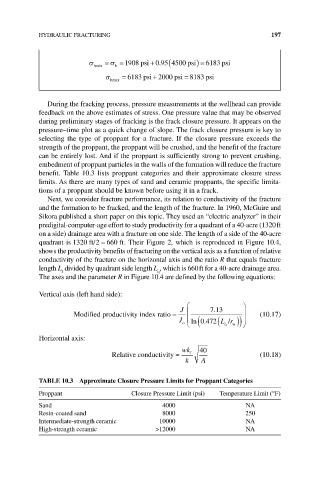
benefit. Table 10.3 lists proppant categories and their approximate closure stress
limits. As there are many types of sand and ceramic proppants, the specific limita-
tions of a proppant should be known before using it in a frack.
Next, we consider fracture performance, its relation to conductivity of the fracture
and the formation to be fracked, and the length of the fracture. In 1960, McGuire and
Sikora published a short paper on this topic. They used an “electric analyzer” in their
predigital‐computer‐age effort to study productivity for a quadrant of a 40‐acre (1320 ft
on a side) drainage area with a fracture on one side. The length of a side of the 40‐acre
quadrant is 1320 ft/ = 660 ft. Their Figure 2, which is reproduced in Figure 10.4,
2
shows the productivity benefits of fracturing on the vertical axis as a function of relative
conductivity of the fracture on the horizontal axis and the ratio R that equals fracture
length L divided by quadrant side length L , which is 660 ft for a 40‐acre drainage area.
q
f
The axes and the parameter R in Figure 10.4 are defined by the following equations:
Vertical axis (left hand side):
.
J 713
Modified productivity indexratio = (10.17)
J o ln / ))
( 0 472. q ( Lr w
Horizontal axis:
wk 40
Relativeconductivity = f (10.18)
k A
TAbLE 10.3 Approximate Closure Pressure Limits for Proppant Categories
Proppant Closure Pressure Limit (psi) Temperature Limit (°F)
Sand 4000 NA
Resin‐coated sand 8000 250
Intermediate‐strength ceramic 10000 NA
High‐strength ceramic >12000 NA