
Page 140 - Introduction to chemical reaction engineering and kinetics
P. 140
122 Chapter 6: Fundamentals of Reaction Rates
rBC A Potential enerlzv
I -
.-r
‘AB
I
A + BC, Products A:BC
(a) (b)
[ABC?
t
Potential
energy
Products
+ A + B C
Reaction coordinate -
(c)
Atomic
configuration
(d)
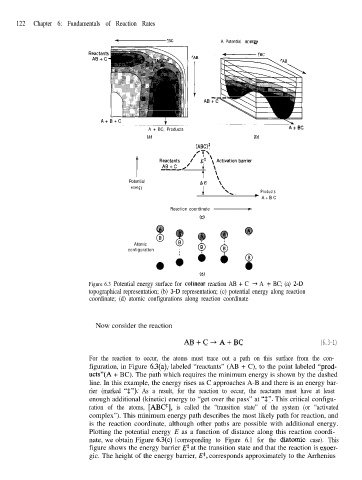
Figure 6.3 Potential energy surface for colinear reaction AB + C + A + BC; (a) 2-D
topographical representation; (b) 3-D representation; (c) potential energy along reaction
coordinate; (d) atomic configurations along reaction coordinate
Now consider the reaction
AB+C+A+BC (6.3-1)
For the reaction to occur, the atoms must trace out a path on this surface from the con-
figuration, in Figure 6.3(a), labeled “reactants” (AB + C), to the point labeled “prod-
ucts”(A + BC). The path which requires the minimum energy is shown by the dashed
line. In this example, the energy rises as C approaches A-B and there is an energy bar-
rier (marked “t”). As a result, for the reaction to occur, the reactants must have at least
enough additional (kinetic) energy to “get over the pass” at “$“. This critical configu-
ration of the atoms, [ABC$], is called the “transition state” of the system (or “activated
complex”). This minimum energy path describes the most likely path for reaction, and
is the reaction coordinate, although other paths are possible with additional energy.
Plotting the potential energy E as a function of distance along this reaction coordi-
nate, we obtain Figure 6.3(c) ( corresponding to Figure 6.1 for the diatomic case). This
figure shows the energy barrier E* at the transition state and that the reaction is exoer-
gic. The height of the energy barrier, Et, corresponds approximately to the Arrhenius