
Page 357 - Laboratory Manual in Physical Geology
P. 357
A CTIVIT Y 12.4 Land Subsidence from Groundwater Withdrawal
Name: ______________________________________ Course/Section: ______________________ Date: ___________
A. Santa Clara Valley, California.
1. In FIGURE 12.9 on page 320 , where are the areas of greatest subsidence in the Santa Clara Valley?
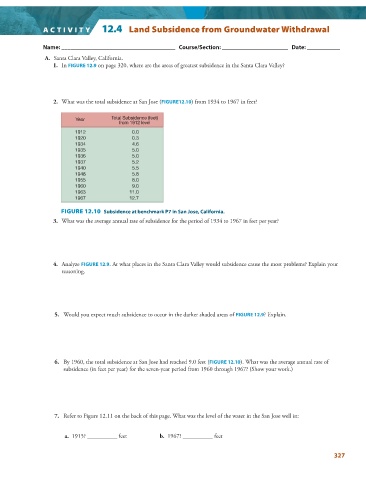
2. What was the total subsidence at San Jose ( FIGURE 12.10 ) from 1934 to 1967 in feet?
Year Total Subsidence (feet)
from 1912 level
1912 0.0
1920 0.3
1934 4.6
1935 5.0
1936 5.0
1937 5.2
1940 5.5
1948 5.8
1955 8.0
1960 9.0
1963 11.0
1967 12.7
FIGURE 12.10 Subsidence at benchmark P7 in San Jose, California.
3. What was the average annual rate of subsidence for the period of 1934 to 1967 in feet per year?
4. Analyze FIGURE 12.9 . At what places in the Santa Clara Valley would subsidence cause the most problems? Explain your
reasoning.
5. Would you expect much subsidence to occur in the darker shaded areas of FIGURE 12.9 ? Explain.
6. By 1960, the total subsidence at San Jose had reached 9.0 feet ( FIGURE 12.10 ). What was the average annual rate of
subsidence (in feet per year) for the seven-year period from 1960 through 1967? (Show your work.)
7. Refer to Figure 12.11 on the back of this page. What was the level of the water in the San Jose well in:
a. 1915? __________ feet b. 1967? __________ feet
327