
Page 358 - Laboratory Manual in Physical Geology
P. 358
+ 20
LS 0
– 40 0
Water table level (feet above and below land surface LS)
– 80 2
– 120 4
Subsidence (feet)
– 160 6
– 200 8
– 240 10
12
14
1915 1920 1930 1940 1950 1960 1970
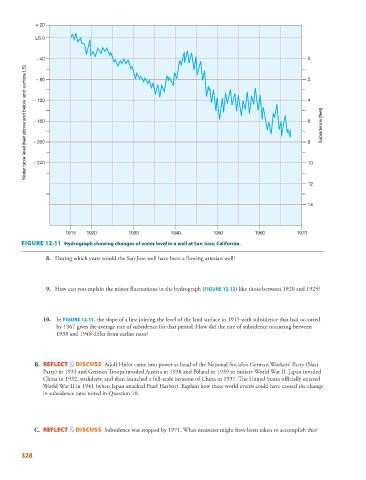
FIGURE 12.11 Hydrograph showing changes of water level in a well at San Jose, California.
8. During which years would the San Jose well have been a flowing artesian well?
9. How can you explain the minor fluctuations in the hydrograph ( FIGURE 12.12 ) like those between 1920 and 1925?
10. In FIGURE 12.11 , the slope of a line joining the level of the land surface in 1915 with subsidence that had occurred
by 1967 gives the average rate of subsidence for that period. How did the rate of subsidence occurring between
1938 and 1948 differ from earlier rates?
B. REFLECT & DISCUSS Adolf Hitler came into power as head of the National Socialist German Workers’ Party (Nazi
Party) in 1933 and German Troops invaded Austria in 1938 and Poland in 1939 to initiate World War II. Japan invaded
China in 1932, withdrew, and then launched a full-scale invasion of China in 1937. The United States officially entered
World War II in 1941 (when Japan attacked Pearl Harbor). Explain how these world events could have caused the change
in subsidence rates noted in Question 10.
C. REFLECT & DISCUSS Subsidence was stopped by 1971. What measures might have been taken to accomplish this?
328