Page 385 - Laboratory Manual in Physical Geology
P. 385

A CTIVIT Y        13.5  Nisqually Glacier Response to Climate Change


                 Name: ______________________________________   Course/Section: ______________________   Date: ___________


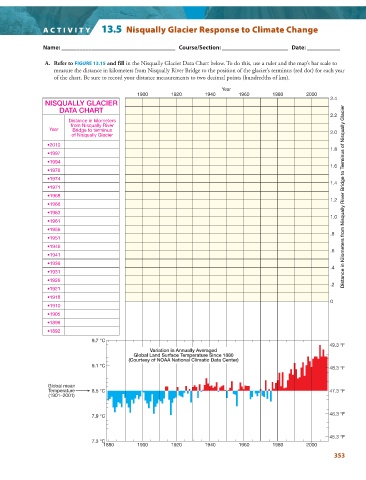
                  A.  Refer to FIGURE  13.15 and fill  in the Nisqually Glacier Data Chart below. To do this, use a ruler and the map’s bar scale to

                   measure the distance in kilometers from Nisqually River Bridge to the position of the glacier’s terminus (red dot) for each year
                   of the chart. Be sure to record your distance measurements to two decimal points (hundredths of km).
                                                                           Year
                                               1900       1920       1940        1960       1980       2000
                                                                                                               2.4
                NISQUALLY GLACIER
                     DATA CHART
                                                                                                               2.2
                        Distance in kilometers
                         from Nisqually River
                 Year    Bridge to terminus                                                                    2.0
                         of Nisqually Glacier
                 •2010
                                                                                                               1.8
                 •1997
                 •1994
                                                                                                               1.6
                 •1976
                 •1974
                                                                                                               1.4
                 •1971
                 •1968                                                                                              Distance in Kilometers from Nisqually River Bridge to Terminus of Nisqually Glacier
                                                                                                               1.2
                 •1966
                 •1963
                                                                                                               1.0
                 •1961
                 •1956
                                                                                                               .8
                 •1951
                 •1946
                                                                                                               .6
                 •1941
                 •1936
                                                                                                               .4
                 •1931
                 •1926
                                                                                                               .2
                 •1921
                 •1918
                                                                                                               0
                 •1910
                 •1905
                 •1896
                 •1892
                                9.7 °C
                                                                                                               49.3 °F
                                                   Variation in Annually Averaged
                                              Global Land Surface Temperature Since 1880
                                            (Courtesy of NOAA National Climatic Data Center)
                                9.1 °C
                                                                                                               48.3 °F

                 Global mean
                 Temperature    8.5 °C                                                                         47.3 °F
                 (1901–2001)


                                                                                                               46.3 °F
                                7.9 °C


                                                                                                               45.3 °F
                                7.3 °C
                                    1880       1900       1920       1940        1960       1980       2000
                                                                                                                 353
   380   381   382   383   384   385   386   387   388   389   390