
Page 68 - Laboratory Manual in Physical Geology
P. 68
But if you ever dove into the deep end of a swimming in the crystal enough to melt the crystal. Consequently,
pool, then you experienced the confining pressure exerted an increase in confining pressure causes an increase in the
by the water plus the confining pressure of the atmosphere. melting point of a mineral. Reducing confining pressure
The deeper you dove, the more pressure you felt. It takes lowers the melting point of a mineral. This means that if a
10 m (33.9 ft) of water to exert another 1 atm of confining mineral is already near its melting point, and its confining
pressure on your body. pressure decreases enough, then it will melt. This is called
Rocks are about three times denser than water, so it decompression melting .
takes only about 3.3 m of rock to exert a force equal to
that of 10 m of water or the entire thickness of the atmo- Pressure-Temperature (P-T) Diagrams
sphere! 100 m of rock exert a confining pressure of about
30 atm, and 1 km (1000 m) of rock exerts a confining Geologists understand that rock melting (the origin of
pressure of about 300 atm. At 300 atm/km, a rock buried magma) is related to both temperature and pressure.
5 km underground is confined by 1500 atm of pressure! Therefore, they heat and pressurize rock samples under
controlled conditions in geochemical laboratories to
determine how rock melting is influenced by specific
Decompression Melting. The confining pressure under
kilometers of rock is so great that a mineral crystal cannot combinations of both pressure and temperature. Samples
melt at its “normal” melting point observed on Earth’s sur- are pressurized and heated to specific P-T points to
face. The pressure confines the atoms and molecules and determine if they remain solid, undergo partial melting,
prevents them from flowing apart. More heat is required or melt completely. The data are then plotted as specific
to raise the kinetic energy level of atoms and molecules points on a pressure-temperature (P-T) diagram such
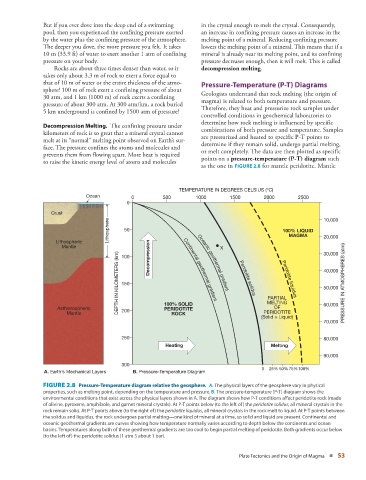
as the one in FIGURE 2.8 for mantle peridotite. Mantle
TEMPERATURE IN DEGREES CELSIUS (°C)
Ocean 0 500 1000 1500 2000 2500
0
Crust 10,000
Lithosphere 50 100% LIQUID
MAGMA
Lithospheric 20,000
Mantle 100 Decompression Continental geothermal X 30,000
DEPTH IN KILOMETERS (km) 150 gradient gradient Peridotite Peridotite 40,000 PRESSURE IN ATMOSPHERES (atm)
Oceanic geothermal
50,000
solidus
PARTIAL
liquidus
OF
Asthenospheric 200 100% SOLID MELTING 60,000
PERIDOTITE
Mantle ROCK PERIDOTITE
(Solid + Liquid)
70,000
250 80,000
Heating Melting
90,000
300
0 25% 50% 75%100%
A. Earth’s Mechanical Layers B. Pressure-Temperature Diagram
FIGURE 2.8 Pressure-Temperature diagram relative the geosphere. A. The physical layers of the geosphere vary in physical
properties, such as melting point, depending on the temperature and pressure. B. The pressure-temperature (P-T) diagram shows the
environmental conditions that exist across the physical layers shown in A. The diagram shows how P-T conditions affect peridotite rock (made
of olivine, pyroxene, amphibole, and garnet mineral crystals). At P-T points below (to the left of) the peridotite solidus, all mineral crystals in the
rock remain solid. At P-T points above (to the right of) the peridotite liquidus, all mineral crystals in the rock melt to liquid. At P-T points between
the solidus and liquidus, the rock undergoes partial melting—one kind of mineral at a time, so solid and liquid are present. Continental and
oceanic geothermal gradients are curves showing how temperature normally varies according to depth below the continents and ocean
basins. Temperatures along both of these geothermal gradients are too cool to begin partial melting of peridotite. Both gradients occur below
(to the left of) the peridotite solidus (1 atm 5 about 1 bar).
Plate Tectonics and the Origin of Magma ■ 53