
Page 64 - Laboratory Manual in Physical Geology
P. 64
Seismic Tomography (80 km depth)
60
60
60
30
0
–30
–60
RED: Less dense, BLUE: More dense,
warmer rocks cooler rocks
–5 –4 –3 –2 –1 0 1 2 3 4 5
Shear-speed anomaly (%)
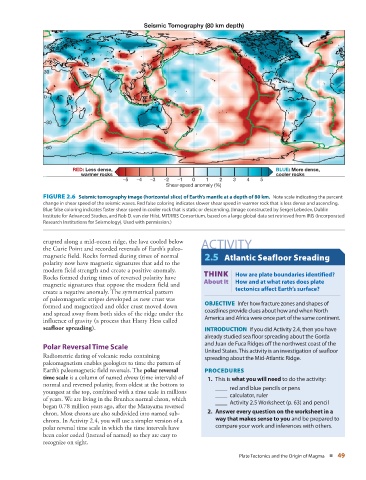
FIGURE 2.6 Seismic tomography image (horizontal slice) of Earth’s mantle at a depth of 80 km. Note scale indicating the percent
change in shear speed of the seismic waves. Red false coloring indicates slower shear speed in warmer rock that is less dense and ascending.
Blue false coloring indicates faster shear speed in cooler rock that is static or descending. (Image constructed by Sergei Lebedev, Dublin
Institute for Advanced Studies, and Rob D. van der Hilst, MIT/IRIS Consortium, based on a large global data set retrieved from IRIS (Incorporated
Research Institutions for Seismology). Used with permission.)
erupted along a mid-ocean ridge, the lava cooled below ACTIVITY
the Curie Point and recorded reversals of Earth’s paleo-
magnetic field. Rocks formed during times of normal 2.5 Atlantic Seafloor Sreading
polarity now have magnetic signatures that add to the
modern field strength and create a positive anomaly. THINK
Rocks formed during times of reversed polarity have | How are plate boundaries identified?
magnetic signatures that oppose the modern field and About It How and at what rates does plate
create a negative anomaly. The symmetrical pattern tectonics affect Earth’s surface?
of paleomagnetic stripes developed as new crust was
formed and magnetized and older crust moved down OBJECTIVE Infer how fracture zones and shapes of
and spread away from both sides of the ridge under the coastlines provide clues about how and when North
influence of gravity (a process that Harry Hess called America and Africa were once part of the same continent.
seafloor spreading ). INTRODUCTION If you did Activity 2.4 , then you have
already studied sea floor spreading about the Gorda
and Juan de Fuca Ridges off the northwest coast of the
Polar Reversal Time Scale
United States. This activity is an investigation of seafl oor
Radiometric dating of volcanic rocks containing
spreading about the Mid-Atlantic Ridge.
paleomagnetism enables geologists to time the pattern of
Earth’s paleomagnetic field reversals. The polar reversal PROCEDURES
time scale is a column of named chrons (time intervals) of 1. This is what you will need to do the activity:
normal and reversed polarity, from oldest at the bottom to
____ red and blue pencils or pens
youngest at the top, combined with a time scale in millions
____ calculator, ruler
of years. We are living in the Brunhes normal chron, which
____ Activity 2.5 Worksheet (p. 63 ) and pencil
began 0.78 million years ago, after the Matayama reversed
chron. Most chrons are also subdivided into named sub- 2. Answer every question on the worksheet in a
chrons. In Activity 2.4 , you will use a simpler version of a way that makes sense to you and be prepared to
polar reversal time scale in which the time intervals have compare your work and inferences with others.
been color coded (instead of named) so they are easy to
recognize on sight.
Plate Tectonics and the Origin of Magma ■ 49