
Page 59 - Laboratory Manual in Physical Geology
P. 59
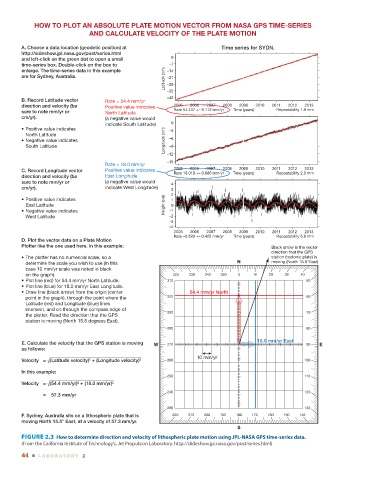
HOW TO PLOT AN ABSOLUTE PLATE MOTION VECTOR FROM NASA GPS TIME-SERIES
                               AND CALCULATE VELOCITY OF THE PLATE MOTION
        A. Choose a data location (geodetic position) at                   Time series for SYDN.
        http://sideshow.jpl.nasa.gov/post/series.html
        and left-click on the green dot to open a small   0
        time-series box. Double-click on the box to       –7
                                                        Latitude (cm)  –28
        enlarge. The time-series data in this example    –14
        are for Sydney, Australia.                       –21

                                                         –35
                                                         –42
        B. Record Latitude vector   Rate = 54.4 mm/yr
        direction and velocity (be   Positive value indicates  2005  2006  2007  2008  2009  2010  2011  2012  2013
        sure to note mm/yr or       North Latitude         Rate 54.437 +– 0.112 mm/yr  Time (years)  Repeatability 1.9 mm
        cm/yr).                     (a negative value would
                                    indicate South Latitude)  0
        •  Positive value indicates                       –3
         North Latitude
        •  Negative value indicates                     Longitude (cm)  –6
         South Latitude                                   –9
                                                         –12
                                                         –15
                                    Rate = 18.0 mm/yr
                                                           2005  2006  2007  2008  2009  2010  2011  2012  2013
        C. Record Longitude vector   Positive value indicates  Rate 18.018 +– 0.088 mm/yr  Time (years)  Repeatability 2.0 mm
        direction and velocity (be   East Longitude
        sure to note mm/yr or       (a negative value would   4
        cm/yr).                     indicate West Longitude)  3
        •  Positive value indicates                       2 1
         East Latitude                                  Height (cm)  0
        •  Negative value indicates                       –1
         West Latitude                                    –2
                                                          –3
                                                          –4
                                                           2005  2006  2007  2008  2009  2010  2011  2012  2013
                                                           Rate –0.520 +– 0.425 mm/yr  Time (years)  Repeatability 5.8 mm
        D. Plot the vector data on a Plate Motion
        Plotter like the one used here. In this example:                                    Black arrow is the vector
                                                                                            direction that the GPS
        • The plotter has no numerical scale, so a                                          station (tectonic plate) is
          determine the scale you wish to use (in this                          N           moving (North 15.5°East)
          case 10 mm/yr scale was noted in black
          on the graph).                                   320  330  340   350  0    10    20   30   40
        • Plot line (red) for 54.4 mm/yr North Latitude.  310                                          50
        • Plot line (blue) for 18.0 mm/yr East Longitude.
        • Draw line (black arrow) from the origin (center        54.4 mm/yr North
          point in the graph), through the point where the  300                                        60
          Latitude (red) and Longitude (blue) lines
          intersect, and on through the compass edge of
                                                         290                                           70
          the plotter. Read the direction that the GPS
          station is moving (North 15.5 degrees East).
                                                         280                                           80

                                                                                       18.0 mm/yr East
        E. Calculate the velocity that the GPS station is moving   W  270                              90   E
        as follows:
                                                                   10 mm/yr
        Velocity   = √(Latitude velocity)  + (Longitude velocity) 2  260                               100
                               2
        In this example:
                                                         250                                           110
                           2
        Velocity   = √(54.4 mm/yr)  + (18.0 mm/yr) 2
                                                         240                                           120
               =    57.3 mm/yr

                                                         230                                           130
        F. Sydney, Australia sits on a lithospheric plate that is   220  210  200  190  180  170  160  150  140
        moving North 15.5° East, at a velocity of 57.3 mm/yr.
                                                                                S

          FIGURE 2.3  How to determine direction and velocity of lithospheric plate motion using JPL-NASA GPS time-series data.
        (From the California Institute of Technology’s, Jet Propulsion Laboratory. http://slideshow.jpl.nasa.gov/post/series.html)
        44  ■  L ABOR ATORY  2