
Page 180 - Lean six sigma demystified
P. 180
Chapter 5 Redu C ing d efe C t S with Six Sigm a 159
The Repair Appointments Success Story
Just to show that everyone in the telephone company wasn’t a complete idiot,
I’d like to tell you another improvement story. One of the states was getting a
lot of customer complaints about unnecessary repair appointments. The cus-
tomer would take a day off work to wait for the repair technician, but no one
would show up. The customer’s telephone, however, would magically start
working again.
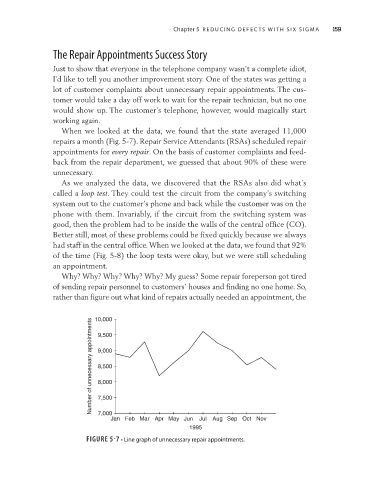
When we looked at the data, we found that the state averaged 11,000
repairs a month (Fig. 5-7). Repair Service Attendants (RSAs) scheduled repair
appointments for every repair. On the basis of customer complaints and feed-
back from the repair department, we guessed that about 90% of these were
unnecessary.
As we analyzed the data, we discovered that the RSAs also did what’s
called a loop test. They could test the circuit from the company’s switching
system out to the customer’s phone and back while the customer was on the
phone with them. Invariably, if the circuit from the switching system was
good, then the problem had to be inside the walls of the central office (CO).
Better still, most of these problems could be fixed quickly because we always
had staff in the central office. When we looked at the data, we found that 92%
of the time (Fig. 5-8) the loop tests were okay, but we were still scheduling
an appointment.
Why? Why? Why? Why? Why? My guess? Some repair foreperson got tired
of sending repair personnel to customers’ houses and finding no one home. So,
rather than figure out what kind of repairs actually needed an appointment, the
10,000
Number of unnecessary appointments 9,500
9,000
8,500
8,000
7,500
7,000
Jan Feb Mar Apr May Jun Jul Aug Sep Oct Nov
1995
FIGURE 5-7 • Line graph of unnecessary repair appointments.