
Page 183 - Lean six sigma demystified
P. 183
162 Lean Six Sigma DemystifieD
10,000
Number of unnecessary repair appointments 7,000 Loop test process
9,000
8,000
change implemented
here
6,000
5,000
4,000
3,000
2,000
1,000
–
Aug Sep Oct Nov Dec Jan Feb Mar
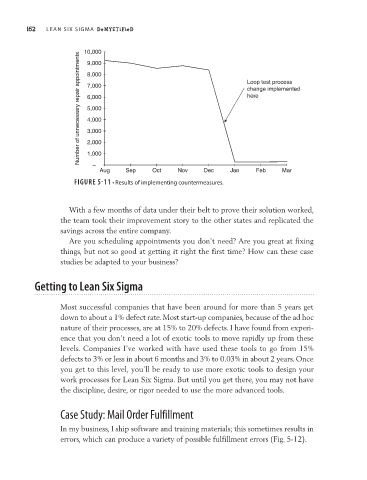
FIGURE 5-11 • Results of implementing countermeasures.
With a few months of data under their belt to prove their solution worked,
the team took their improvement story to the other states and replicated the
savings across the entire company.
Are you scheduling appointments you don’t need? Are you great at fixing
things, but not so good at getting it right the first time? How can these case
studies be adapted to your business?
Getting to Lean Six Sigma
Most successful companies that have been around for more than 5 years get
down to about a 1% defect rate. Most start-up companies, because of the ad hoc
nature of their processes, are at 15% to 20% defects. I have found from experi-
ence that you don’t need a lot of exotic tools to move rapidly up from these
levels. Companies I’ve worked with have used these tools to go from 15%
defects to 3% or less in about 6 months and 3% to 0.03% in about 2 years. Once
you get to this level, you’ll be ready to use more exotic tools to design your
work processes for Lean Six Sigma. But until you get there, you may not have
the discipline, desire, or rigor needed to use the more advanced tools.
Case Study: Mail Order Fulfillment
In my business, I ship software and training materials; this sometimes results in
errors, which can produce a variety of possible fulfillment errors (Fig. 5-12).