Page 188 - Lean six sigma demystified
P. 188

Openmirrors.com

                                                            Chapter 5  Redu C ing   d efe C t S  with   Six   Sigm a          167


                                        Voice of customer


                                                              Define problem to be solved
                                  Define and measure
                              FOCUS


                                                              Line graph       Pareto chart
                                       Balanced scorecard


                              IMPROVE  Improve  and  analyze                      Countermeasures


                                                  Root cause analysis  Verify root cause

                                                                                    BEFORE
                                                                  Problem                   USL
                                            Flowchart  BEFORE      solving     Number of  installations
                                           F
                              SUSTAIN  Monitor,  manage,  and control  I       AFTER  AFTER


                                              S                                            USL
                                           H                                   Number of  installations

                                                  Recognize, review, and refocus
                                        Six sigma
                                      6
                              HONOR  Leadership  5 4 3


                                      1 2   GOOD                                Master QI story
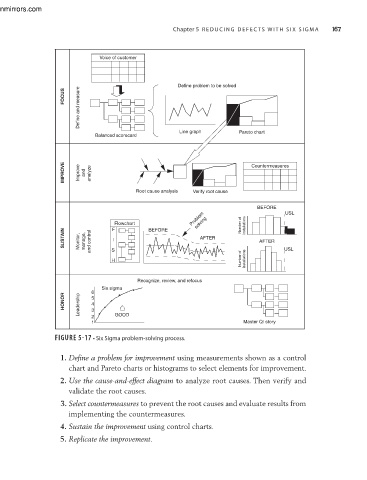
                           FIGURE 5-17 • Six Sigma problem-solving process.

                             1. Define a problem for improvement using measurements shown as a control
                               chart and Pareto charts or histograms to select elements for improvement.
                             2. Use the cause-and-effect diagram to analyze root causes. Then verify and
                               validate the root causes.
                             3. Select countermeasures to prevent the root causes and evaluate results from
                               implementing the countermeasures.
                             4. Sustain the improvement using control charts.

                             5. Replicate the improvement.
   183   184   185   186   187   188   189   190   191   192   193