
Page 193 - Lean six sigma demystified
P. 193
172 Lean Six Sigma DemystifieD
n = 25 Installation service and warranty calls by part
25 100%
21.875 96% 90%
88% 80%
18.75 80% 70%
Number of calls 9.375 11 44% 9 60%
15.625
12.5
50%
40%
6.25 30%
20%
3.125 2 2
1 10%
0 0%
Vinyl T-Lock Door Motor Track
Part
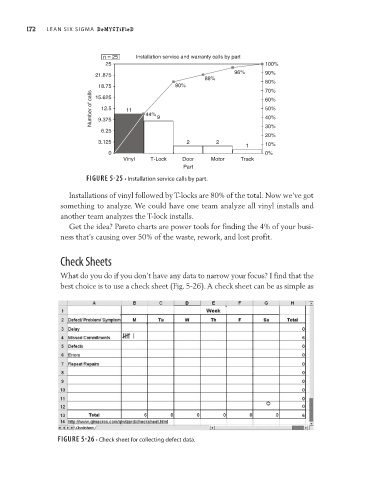
FIGURE 5-25 • Installation service calls by part.
Installations of vinyl followed by T-locks are 80% of the total. Now we’ve got
something to analyze. We could have one team analyze all vinyl installs and
another team analyzes the T-lock installs.
Get the idea? Pareto charts are power tools for finding the 4% of your busi-
ness that’s causing over 50% of the waste, rework, and lost profit.
Check Sheets
What do you do if you don’t have any data to narrow your focus? I find that the
best choice is to use a check sheet (Fig. 5-26). A check sheet can be as simple as
FIGURE 5-26 • Check sheet for collecting defect data.