
Page 190 - Lean six sigma demystified
P. 190
Chapter 5 Redu C ing d efe C t S with Six Sigm a 169
Pareto Charts to Focus Improvement
Problem areas are usually too big and complex to be solved all at once, but when
we whittle them down into small enough pieces, we can fix each one easily and
effectively. This step uses the Pareto chart (a bar chart and a cumulative line graph)
to identify the most important problem to improve first. Often, two or more Pareto
charts are needed to get to a problem specific enough to analyze easily.
Having the control chart of current performance, you’ll want to analyze the
contributors to the problem. A Pareto chart might take any of the following
forms based on the original data:
• Defects—types of defects
• Time—steps or delays in a process
• Cost—types of costs–rework or waste
What to Look For in Your Company Data
Most companies have lots of data, but sometimes have a hard time figuring out
what to do with it. I’ve found that I often use a common strategy for analyzing
a company’s data. I usually slice and dice an Excel table in the same way.
1. I sometimes have to summarize the defect, error, and mistake data using
Excel’s PivotTable function.
2. I use Pareto charts to analyze the total rows and total columns.
3. Then I use Pareto charts to analyze the biggest contributor in each total
row or column.
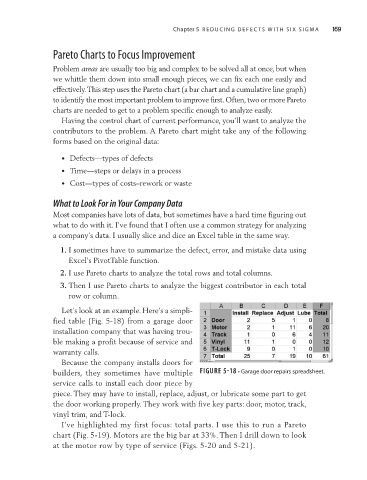
Let’s look at an example. Here’s a simpli-
fied table (Fig. 5-18) from
a garage door
installation company that was having trou-
ble making a profit because of service and
warranty calls.
Because the company installs doors for
builders, they sometimes have multiple FIGURE 5-18 • Garage door repairs spreadsheet.
service calls to install each door piece by
piece. They may have to install, replace, adjust, or lubricate some part to get
the door working properly. They work with five key parts: door, motor, track,
vinyl trim, and T-lock.
I’ve highlighted my first focus: total parts. I use this to run a Pareto
chart (Fig. 5-19). Motors are the big bar at 33%. Then I drill down to look
at the motor row by type of service (Figs. 5-20 and 5-21).