Page 187 - Lean six sigma demystified
P. 187

166        Lean Six Sigma  DemystifieD


                                                         Fulfillment errors
                            30


                            25

                                 UCL                                         19.84
                            20
                                                                                       UCL
                                                                                       +2 Sigma
                                                                                       +1 Sigma
                          Errors  15                                                   Average
                                                                                       –1 Sigma
                                                                                       –2 Sigma
                                 CL                                          10.24     LCL
                            10
                                                                                         7.05

                             5
                                                                                         2.40
                                 L C L                                        6 . 0  4
                             0
                           2000–10 2000–12  2001–02  2001–04  2001–06 2001–08 2001–10  2001–12  2002–02  2002–04 2002–06 2002–08  2002–10  2002–11  2003–01  2003–03

                                                          2000-2003
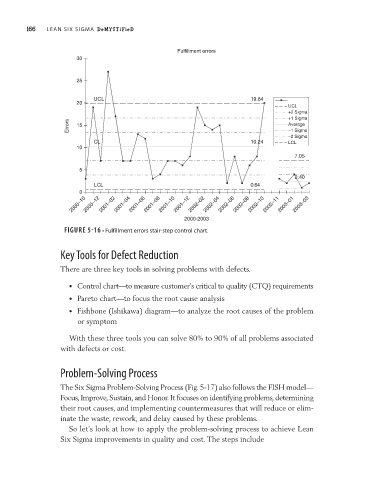
                         FIGURE 5-16 • Fulfillment errors stair-step control chart.


                        Key Tools for Defect Reduction

                        There are three key tools in solving problems with defects.

                          •   Control chart—to measure customer’s critical to quality (CTQ) requirements
                          •   Pareto chart—to focus the root cause analysis
                          •   Fishbone (Ishikawa) diagram—to analyze the root causes of the problem
                             or symptom

                          With these three tools you can solve 80% to 90% of all problems associated
                        with defects or cost.


                        Problem-Solving Process

                        The Six Sigma Problem-Solving Process (Fig. 5-17) also follows the FISH model—
                        Focus, Improve, Sustain, and Honor. It focuses on identifying problems, determining
                        their root causes, and implementing countermeasures that will reduce or elim-
                        inate the waste, rework, and delay caused by these problems.
                          So let’s look at how to apply the problem-solving process to achieve Lean
                        Six Sigma improvements in quality and cost. The steps include
   182   183   184   185   186   187   188   189   190   191   192