
Page 184 - Lean six sigma demystified
P. 184
Chapter 5 Redu C ing d efe C t S with Six Sigm a 163
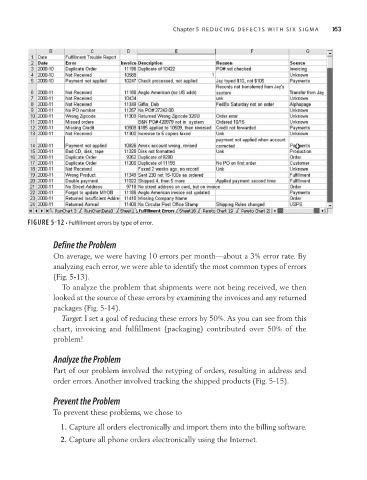
FIGURE 5-12 • Fulfillment errors by type of error.
Define the Problem
On average, we were having 10 errors per month—about a 3% error rate. By
analyzing each error, we were able to identify the most common types of errors
(Fig. 5-13).
To analyze the problem that shipments were not being received, we then
looked at the source of these errors by examining the invoices and any returned
packages (Fig. 5-14).
Target: I set a goal of reducing these errors by 50%. As you can see from this
chart, invoicing and fulfillment (packaging) contributed over 50% of the
problem!
Analyze the Problem
Part of our problem involved the retyping of orders, resulting in address and
order errors. Another involved tracking the shipped products (Fig. 5-15).
Prevent the Problem
To prevent these problems, we chose to
1. Capture all orders electronically and import them into the billing software.
2. Capture all phone orders electronically using the Internet.