Page 192 - Lean six sigma demystified
P. 192

Chapter 5  Redu C ing   d efe C t S  with   Six   Sigm a          171


                             Adjusting the motor is 55% of total motor service and lube is the next 30%
                           (85% total). Now we have something to analyze!

                             A problem well stated is a problem half solved.
                                                            —Charles Franklin Kettering (1876–1958)


                             Once we have narrowed the problem down to a small enough piece, we can write
                           a problem statement about one or more big bars on the Pareto chart. The big bars in
                           the lower-level Pareto charts can be turned into problem statements to fill the head
                           of your fishbone diagram. These will serve as the basis for identifying root causes. We
                           also need to set a target for improvement.
                             Problem Statement: During 2004, adjust-
                           ments accounted for 55% of all motor ser-
                           vice calls, which is higher than desired and
                           caused customer dissatisfaction and a loss
                           of $60 per service call.
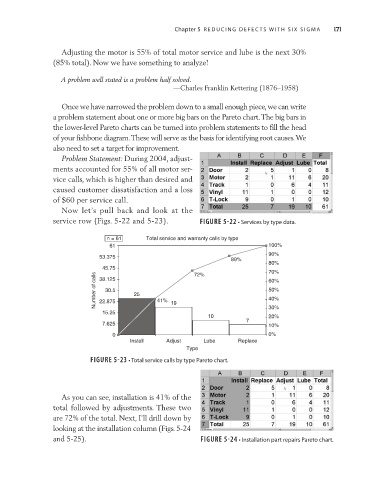
                             Now  let’s  pull  back  and  look  at  the
                           service row (Figs. 5-22 and 5-23).       FIGURE 5-22 • Services by type data.

                                          n = 61     Total service and warranty calls by type
                                           61                                          100%
                                                                                       90%
                                        53.375
                                                                             89%
                                                                                       80%
                                         45.75                    72%                  70%
                                       Number of calls  22.875  25  41%                60%
                                        38.125
                                                                                       50%
                                         30.5
                                                                                       40%
                                         15.25              19        10               30%
                                                                                       20%
                                                                                 7
                                         7.625                                         10%
                                           0                                           0%
                                                Install   Adjust     Lube      Replace
                                                                Type
                                     FIGURE 5-23 • Total service calls by type Pareto chart.


                             As you can see, installation is 41% of the
                           total followed by adjustments. These two
                           are 72% of the total. Next, I’ll drill down by
                           looking at the installation column (Figs. 5-24
                           and 5-25).                               FIGURE 5-24 • Installation part repairs Pareto chart.
   187   188   189   190   191   192   193   194   195   196   197