
Page 150 - Materials Chemistry, Second Edition
P. 150
Environmental Sustainability Assessment of Ethanol 137
5.1.1 NER, NEB and Renewability of Cassava Ethanol
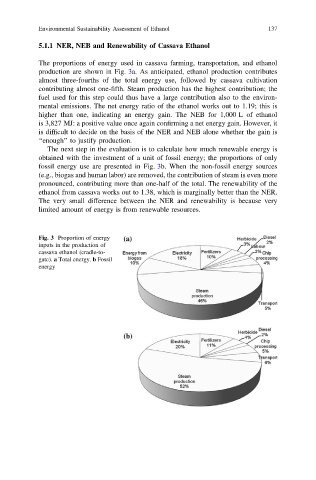
The proportions of energy used in cassava farming, transportation, and ethanol
production are shown in Fig. 3a. As anticipated, ethanol production contributes
almost three-fourths of the total energy use, followed by cassava cultivation
contributing almost one-fifth. Steam production has the highest contribution; the
fuel used for this step could thus have a large contribution also to the environ-
mental emissions. The net energy ratio of the ethanol works out to 1.19; this is
higher than one, indicating an energy gain. The NEB for 1,000 L of ethanol
is 3,827 MJ: a positive value once again confirming a net energy gain. However, it
is difficult to decide on the basis of the NER and NEB alone whether the gain is
‘‘enough’’ to justify production.
The next step in the evaluation is to calculate how much renewable energy is
obtained with the investment of a unit of fossil energy; the proportions of only
fossil energy use are presented in Fig. 3b. When the non-fossil energy sources
(e.g., biogas and human labor) are removed, the contribution of steam is even more
pronounced, contributing more than one-half of the total. The renewability of the
ethanol from cassava works out to 1.38, which is marginally better than the NER.
The very small difference between the NER and renewability is because very
limited amount of energy is from renewable resources.
Fig. 3 Proportion of energy
inputs in the production of
cassava ethanol (cradle-to-
gate). a Total energy. b Fossil
energy