
Page 153 - Materials Chemistry, Second Edition
P. 153
140 S. H. Gheewala
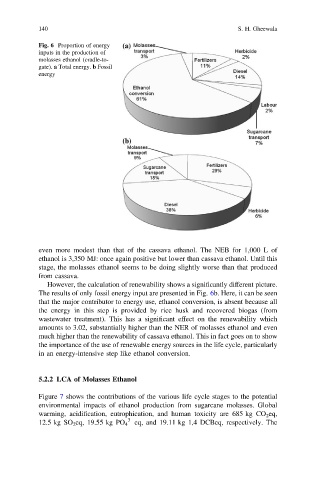
Fig. 6 Proportion of energy
inputs in the production of
molasses ethanol (cradle-to-
gate). a Total energy. b Fossil
energy
even more modest than that of the cassava ethanol. The NEB for 1,000 L of
ethanol is 3,350 MJ: once again positive but lower than cassava ethanol. Until this
stage, the molasses ethanol seems to be doing slightly worse than that produced
from cassava.
However, the calculation of renewability shows a significantly different picture.
The results of only fossil energy input are presented in Fig. 6b. Here, it can be seen
that the major contributor to energy use, ethanol conversion, is absent because all
the energy in this step is provided by rice husk and recovered biogas (from
wastewater treatment). This has a significant effect on the renewability which
amounts to 3.02, substantially higher than the NER of molasses ethanol and even
much higher than the renewability of cassava ethanol. This in fact goes on to show
the importance of the use of renewable energy sources in the life cycle, particularly
in an energy-intensive step like ethanol conversion.
5.2.2 LCA of Molasses Ethanol
Figure 7 shows the contributions of the various life cycle stages to the potential
environmental impacts of ethanol production from sugarcane molasses. Global
warming, acidification, eutrophication, and human toxicity are 685 kg CO 2 eq,
3-
12.5 kg SO 2 eq, 19.55 kg PO 4 eq, and 19.11 kg 1,4 DCBeq, respectively. The