
Page 269 - Materials Chemistry, Second Edition
P. 269
Hydropower Life-Cycle Inventories 259
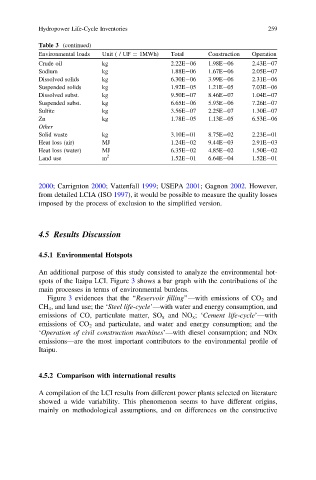
Table 3 (continued)
Environmental loads Unit ( / UF = 1MWh) Total Construction Operation
Crude oil kg 2.22E-06 1.98E-06 2.43E-07
Sodium kg 1.88E-06 1.67E-06 2.05E-07
Dissolved solids kg 6.30E-06 3.99E-06 2.31E-06
Suspended solids kg 1.92E-05 1.21E-05 7.03E-06
Dissolved subst. kg 9.50E-07 8.46E-07 1.04E-07
Suspended subst. kg 6.65E-06 5.93E-06 7.26E-07
Sulfite kg 3.56E-07 2.25E-07 1.30E-07
Zn kg 1.78E-05 1.13E-05 6.53E-06
Other
Solid waste kg 3.10E-01 8.75E-02 2.23E-01
Heat loss (air) MJ 1.24E-02 9.44E-03 2.91E-03
Heat loss (water) MJ 6.35E-02 4.85E-02 1.50E-02
2
Land use m 1.52E-01 6.64E-04 1.52E-01
2000; Carrignton 2000; Vattenfall 1999; USEPA 2001; Gagnon 2002. However,
from detailed LCIA (ISO 1997), it would be possible to measure the quality losses
imposed by the process of exclusion to the simplified version.
4.5 Results Discussion
4.5.1 Environmental Hotspots
An additional purpose of this study consisted to analyze the environmental hot-
spots of the Itaipu LCI. Figure 3 shows a bar graph with the contributions of the
main processes in terms of environmental burdens.
Figure 3 evidences that the ‘‘Reservoir filling’’—with emissions of CO 2 and
CH 4 , and land use; the ‘Steel life-cycle’—with water and energy consumption, and
emissions of CO, particulate matter, SO x and NO x ;‘Cement life-cycle’—with
emissions of CO 2 and particulate, and water and energy consumption; and the
‘Operation of civil construction machines’—with diesel consumption; and NOx
emissions—are the most important contributors to the environmental profile of
Itaipu.
4.5.2 Comparison with international results
A compilation of the LCI results from different power plants selected on literature
showed a wide variability. This phenomenon seems to have different origins,
mainly on methodological assumptions, and on differences on the constructive