
Page 270 - Materials Chemistry, Second Edition
P. 270
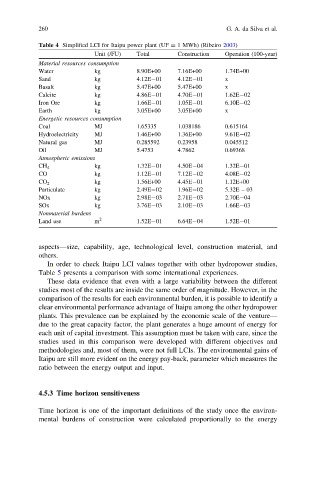
260                                                 G. A. da Silva et al.
            Table 4 Simplified LCI for Itaipu power plant (UF = 1 MWh) (Ribeiro 2003)
                           Unit (/FU)  Total      Construction  Operation (100-year)
            Material resources consumption
            Water          kg          8.90E+00   7.16E+00      1.74E+00
            Sand           kg          4.12E-01   4.12E-01      x
            Basalt         kg          5.47E+00   5.47E+00      x
            Calcite        kg          4.86E-01   4.70E-01      1.62E-02
            Iron Ore       kg          1.66E-01   1.05E-01      6.10E-02
            Earth          kg          3.05E+00   3.05E+00      x
            Energetic resources consumption
            Coal           MJ          1.65335    1.038186      0.615164
            Hydroelectricity  MJ       1.46E+00   1.36E+00      9.61E-02
            Natural gas    MJ          0.285592   0.23958       0.045512
            Oil            MJ          5.4753     4.7862        0.69368
            Atmospheric emissions
            CH 4           kg          1.32E-01   4.50E-04      1.32E-01
            CO             kg          1.12E-01   7.12E-02      4.08E-02
            CO 2           kg          1.56E+00   4.45E-01      1.12E+00
            Particulate    kg          2.49E-02   1.96E-02      5.32E – 03
            NOx            kg          2.98E-03   2.71E-03      2.70E-04
            SOx            kg          3.76E-03   2.10E-03      1.66E-03
            Nonmaterial burdens
            Land use       m 2         1.52E-01   6.64E-04      1.52E-01


            aspects—size, capability, age, technological level, construction material, and
            others.
              In order to check Itaipu LCI values together with other hydropower studies,
            Table 5 presents a comparison with some international experiences.
              These data evidence that even with a large variability between the different
            studies most of the results are inside the same order of magnitude. However, in the
            comparison of the results for each environmental burden, it is possible to identify a
            clear environmental performance advantage of Itaipu among the other hydropower
            plants. This prevalence can be explained by the economic scale of the venture—
            due to the great capacity factor, the plant generates a huge amount of energy for
            each unit of capital investment. This assumption must be taken with care, since the
            studies used in this comparison were developed with different objectives and
            methodologies and, most of them, were not full LCIs. The environmental gains of
            Itaipu are still more evident on the energy pay-back, parameter which measures the
            ratio between the energy output and input.


            4.5.3 Time horizon sensitiveness

            Time horizon is one of the important definitions of the study once the environ-
            mental burdens of construction were calculated proportionally to the energy