
Page 285 - Materials Chemistry, Second Edition
P. 285
13.3 Case study 283
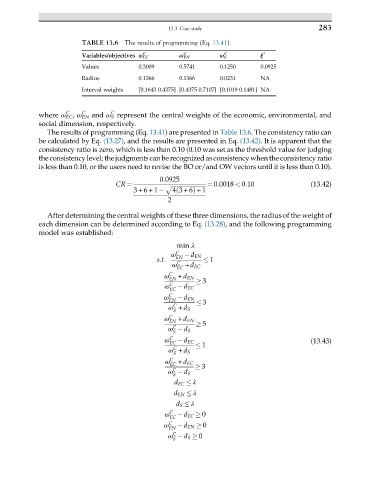
TABLE 13.6 The results of programming (Eq. 13.41).
C C C ξ ∗
Variables/objectives ω EC ω EN ω S
Values 0.3009 0.5741 0.1250 0.0925
Radius 0.1366 0.1366 0.0231 NA
Interval weights [0.1643 0.4375] [0.4375 0.7107] [0.1019 0.1481] NA
C
C
C
where ω EC , ω EN and ω S represent the central weights of the economic, environmental, and
social dimension, respectively.
The results of programming (Eq. 13.41) are presented in Table 13.6. The consistency ratio can
be calculated by Eq. (13.27), and the results are presented in Eq. (13.42).Itis apparent that the
consistency ratio is zero, which is less than 0.10 (0.10 was set as the threshold value for judging
the consistency level;the judgments can be recognized asconsistency whenthe consistency ratio
is less than 0.10, or the users need to revise the BO or/and OW vectors until it is less than 0.10).
0:0925
ffiffiffiffiffiffiffiffiffiffiffiffiffiffiffiffiffiffiffiffiffiffiffi ¼ 0:0018 < 0:10 (13.42)
CR ¼ p
Þ +1
3+6+1 43 + 6ð
2
After determining the central weights of these three dimensions, the radius of the weight of
each dimension can be determined according to Eq. (13.28), and the following programming
model was established:
min λ
ω C d EN
s:t: EN 1
ω C
EC + d EC
ω C
EN + d EN 3
ω C
EC d EC
ω C d EN
EN
C 3
ω + d S
S
ω C
EN + d EN 5
C
ω d S
S
ω C
EC d EC 1 (13.43)
C
ω + d S
S
ω C EC + d EC
C 3
ω d S
S
d EC λ
d EN λ
d S λ
ω C d EC 0
EC
ω C d EN 0
EN
C
ω d S 0
S