
Page 346 - Lindens Handbook of Batteries
P. 346
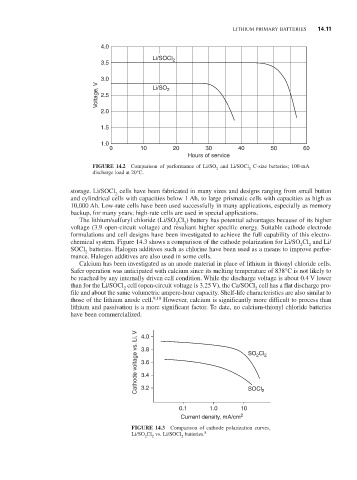
LiTHiUM PriMAry BATTerieS        14.11

                                         4.0
                                                       Li/SOCl 2
                                         3.5

                                         3.0
                                        Voltage, V  2.5  Li/SO 2


                                         2.0

                                         1.5

                                         1.0
                                           0       10       20       30       40       50       60
                                                                 Hours of service
                                      FIGURE  14.2  Comparison  of  performance  of  Li/SO   and  Li/SOCl   C-size  batteries;  100-mA
                                                                        2
                                                                                 2
                                      discharge load at 20°C.
                                storage. Li/SOCl  cells have been fabricated in many sizes and designs ranging from small button
                                             2
                                and cylindrical cells with capacities below 1 Ah, to large prismatic cells with capacities as high as
                                10,000 Ah. Low-rate cells have been used successfully in many applications, especially as memory
                                backup, for many years; high-rate cells are used in special applications.
                                   The lithium/sulfuryl chloride (Li/SO Cl ) battery has potential advantages because of its higher
                                                             2
                                                                2
                                voltage (3.9 open-circuit voltage) and resultant higher specific energy. Suitable cathode electrode
                                formulations and cell designs have been investigated to achieve the full capability of this electro-
                                chemical system. Figure 14.3 shows a comparison of the cathode polarization for Li/SO Cl  and Li/
                                                                                                2
                                                                                                  2
                                SOCl  batteries. Halogen additives such as chlorine have been used as a means to improve perfor-
                                    2
                                mance. Halogen additives are also used in some cells.
                                   Calcium has been investigated as an anode material in place of lithium in thionyl chloride cells.
                                Safer operation was anticipated with calcium since its melting temperature of 838°C is not likely to
                                be reached by any internally driven cell condition. While the discharge voltage is about 0.4 V lower
                                than for the Li/SOCl  cell (open-circuit voltage is 3.25 V), the Ca/SOCl  cell has a flat discharge pro-
                                                                                   2
                                               2
                                file and about the same volumetric ampere-hour capacity. Shelf-life characteristics are also similar to
                                those of the lithium anode cell. 9,10  However, calcium is significantly more difficult to process than
                                lithium and passivation is a more significant factor. To date, no calcium-thionyl chloride batteries
                                have been commercialized. 4.0
                                                  Cathode voltage vs. Li, V  3.8  SO Cl 2
                                                                                   2
                                                    3.6

                                                    3.4
                                                    3.2

                                                              0.1      1.0     10 SOCl 2
                                                               Current density, mA/cm 2
                                                 FIGURE  14.3  Comparison  of  cathode  polarization  curves,
                                                 Li/SO Cl  vs. Li/SOCl  batteries. 8
                                                     2  2      2