
Page 394 - Lindens Handbook of Batteries
P. 394
LiTHiUM PriMAry BATTerieS 14.59
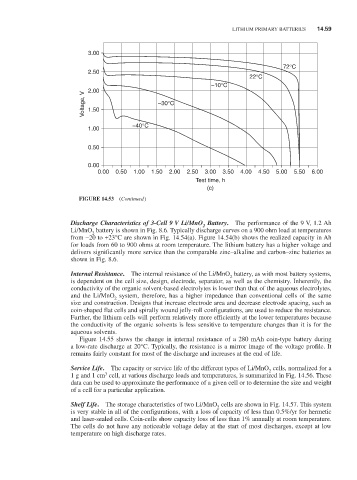
3.00
72°C
2.50
22°C
–10°C
2.00
Voltage, V 1.50 –30°C
1.00 –40°C
0.50
0.00
0.00 0.50 1.00 1.50 2.00 2.50 3.00 3.50 4.00 4.50 5.00 5.50 6.00
Test time, h
(c)
FIGURE 14.53 (Continued )
Discharge Characteristics of 3-Cell 9 V Li/MnO Battery. The performance of the 9 V, 1.2 Ah
2
Li/MnO battery is shown in Fig. 8.6. Typically discharge curves on a 900 ohm load at temperatures
2
from -20 to +23°C are shown in Fig. 14.54(a). Figure 14.54(b) shows the realized capacity in Ah
for loads from 60 to 900 ohms at room temperature. The lithium battery has a higher voltage and
delivers significantly more service than the comparable zinc–alkaline and carbon–zinc batteries as
shown in Fig. 8.6.
Internal Resistance. The internal resistance of the Li/MnO battery, as with most battery systems,
2
is dependent on the cell size, design, electrode, separator, as well as the chemistry. inherently, the
conductivity of the organic solvent-based electrolytes is lower than that of the aqueous electrolytes,
and the Li/MnO system, therefore, has a higher impedance than conventional cells of the same
2
size and construction. Designs that increase electrode area and decrease electrode spacing, such as
coin-shaped flat cells and spirally wound jelly-roll configurations, are used to reduce the resistance.
Further, the lithium cells will perform relatively more efficiently at the lower temperatures because
the conductivity of the organic solvents is less sensitive to temperature changes than it is for the
aqueous solvents.
Figure 14.55 shows the change in internal resistance of a 280 mAh coin-type battery during
a low-rate discharge at 20°C. Typically, the resistance is a mirror image of the voltage profile. it
remains fairly constant for most of the discharge and increases at the end of life.
Service Life. The capacity or service life of the different types of Li/MnO cells, normalized for a
2
1 g and 1 cm cell, at various discharge loads and temperatures, is summarized in Fig. 14.56. These
3
data can be used to approximate the performance of a given cell or to determine the size and weight
of a cell for a particular application.
Shelf Life. The storage characteristics of two Li/MnO cells are shown in Fig. 14.57. This system
2
is very stable in all of the configurations, with a loss of capacity of less than 0.5%/yr for hermetic
and laser-sealed cells. Coin-cells show capacity loss of less than 1% annually at room temperature.
The cells do not have any noticeable voltage delay at the start of most discharges, except at low
temperature on high discharge rates.