
Page 49 - Lindens Handbook of Batteries
P. 49
2.6 PRINCIPLES OF OPERATION
The forward and backward reactions can be described by heterogeneous rate constants k and k ,
f
b
respectively. The rates of the forward and backward reactions are then given by the products of these
rate constants and the relevant concentrations, which typically are those at the electrode surface.
As will be shown later, the concentrations of electroactive species at the electrode surface often are
dissimilar from the bulk concentration in solution. The rate of the forward reaction is k C and that
f o
for the backward reaction is k C . For convenience, these rates are usually expressed in terms of
b R
currents i and i for the forward and backward reactions, respectively,
f
b
i = nFAk C (2.10)
f
O
f
i = nFAk C (2.11)
b R
b
where A is the area of the electrode and F the Faraday.
Establishing these expressions is merely the result of applying the law of mass action to the for-
ward and backward electrochemical processes. The role of electrons in the process is established by
assuming that the magnitudes of the rate constants depend on the electrode potential. The dependence
is usually described by assuming that a fraction αE of the electrode potential is involved in driving
the reduction process, while the fraction (1 - α)E is effective in making the reoxidation process more
difficult. Mathematically, these potential-dependent rate constants are expressed as
nFE
k = k exp -α RT (2.12)
o
f
f
k = k exp (1 - )α nFE (2.13)
o
b
b
RT
where α is the transfer coefficient and E the electrode potential relative to a suitable reference
potential.
A little more explanation regarding what the transfer coefficient α (or the symmetry factor β as it
is referred to in some texts) means in mechanistic terms is appropriate since this term is not implicit in
the kinetic derivation. The transfer coefficient determines what fraction of the electric energy resulting
2
from the displacement of the potential from the equilibrium value affects the rate of electrochemical
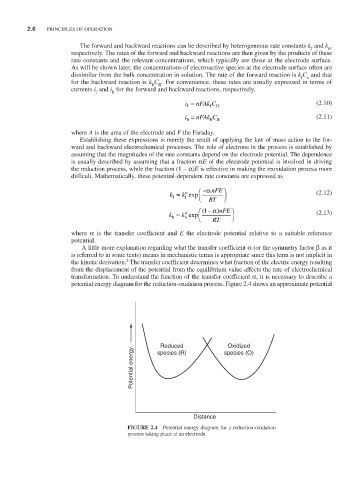
transformation. To understand the function of the transfer coefficient α, it is necessary to describe a
potential energy diagram for the reduction-oxidation process. Figure 2.4 shows an approximate potential
Oxidized
Reduced species (O)
Potential energy
species (R)
Distance
FIGURE 2.4 Potential energy diagram for a reduction-oxidation
process taking place at an electrode.