
Page 50 - Lindens Handbook of Batteries
P. 50
ELECTROCHEMICAL PRINCIPLES AND REACTIONS 2.7
m 1
α =
m + m 2
1
Potential energy αE
m 2 m 1
E
M H H + H O
2
Distance
+
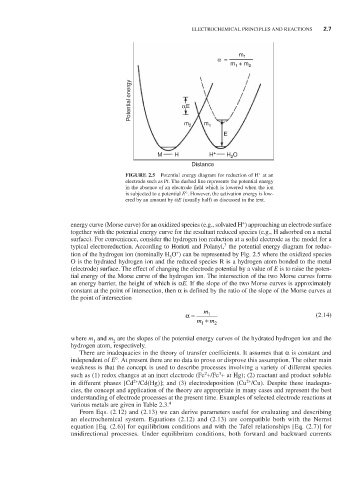
FIGURE 2.5 Potential energy diagram for reduction of H at an
electrode such as Pt. The dashed line represents the potential energy
in the absence of an electrode field which is lowered when the ion
is subjected to a potential E°. However, the activation energy is low-
ered by an amount by αE (usually half) as discussed in the text.
+
energy curve (Morse curve) for an oxidized species (e.g., solvated H ) approaching an electrode surface
together with the potential energy curve for the resultant reduced species (e.g., H adsorbed on a metal
surface). For convenience, consider the hydrogen ion reduction at a solid electrode as the model for a
3
typical electroreduction. According to Horiuti and Polanyi, the potential energy diagram for reduc-
+
tion of the hydrogen ion (nominally H O ) can be represented by Fig. 2.5 where the oxidized species
3
O is the hydrated hydrogen ion and the reduced species R is a hydrogen atom bonded to the metal
(electrode) surface. The effect of changing the electrode potential by a value of E is to raise the poten-
tial energy of the Morse curve of the hydrogen ion. The intersection of the two Morse curves forms
an energy barrier, the height of which is αE. If the slope of the two Morse curves is approximately
constant at the point of intersection, then α is defined by the ratio of the slope of the Morse curves at
the point of intersection
m
α= 1 (2.14)
m 1 + m 2
where m and m are the slopes of the potential energy curves of the hydrated hydrogen ion and the
1
2
hydrogen atom, respectively.
There are inadequacies in the theory of transfer coefficients. It assumes that α is constant and
independent of E°. At present there are no data to prove or disprove this assumption. The other main
weakness is that the concept is used to describe processes involving a variety of different species
2
3
such as (1) redox changes at an inert electrode (Fe +/Fe + at Hg); (2) reactant and product soluble
2+
2+
in different phases [Cd /Cd(Hg)]; and (3) electrodeposition (Cu /Cu). Despite these inadequa-
cies, the concept and application of the theory are appropriate in many cases and represent the best
understanding of electrode processes at the present time. Examples of selected electrode reactions at
various metals are given in Table 2.3. 4
From Eqs. (2.12) and (2.13) we can derive parameters useful for evaluating and describing
an electrochemical system. Equations (2.12) and (2.13) are compatible both with the Nernst
equation [Eq. (2.6)] for equilibrium conditions and with the Tafel relationships [Eq. (2.7)] for
unidirectional processes. Under equilibrium conditions, both forward and backward currents