
Page 166 - Lindens Handbook of Batteries
P. 166
MATHEMATICAL MODELING OF BATTERIES 6.19
e
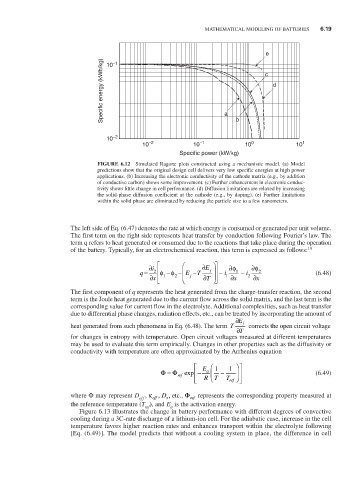
Specific energy (kWh/kg) a c d
–1
10
10 –2 b
10 –2 10 –1 10 0 10 1
Specific power (kW/kg)
FiguRE 6.12 Simulated Ragone plots constructed using a mechanistic model. (a) Model
predictions show that the original design cell delivers very low specific energies at high power
applications. (b) Increasing the electronic conductivity of the cathode matrix (e.g., by addition
of conductive carbon) shows some improvement. (c) Further enhancement in electronic conduc-
tivity shows little change in cell performance. (d) Diffusion limitations are relaxed by increasing
the solid-phase diffusion coefficient at the cathode (e.g., by doping). (e) Further limitations
within the solid phase are eliminated by reducing the particle size to a few nanometers.
The left side of Eq. (6.47) denotes the rate at which energy is consumed or generated per unit volume.
The first term on the right side represents heat transfer by conduction following Fourier’s law. The
term q refers to heat generated or consumed due to the reactions that take place during the operation
of the battery. Typically, for an electrochemical reaction, this term is expressed as follows: 19
i ∂ ∂ E ∂φ ∂φ
q = 2 - φ - φ E - T j - i 1 - i i 2 (6.48)
x ∂ 1 2 j ∂ T 1 x ∂ 2 x ∂
The first component of q represents the heat generated from the charge-transfer reaction, the second
term is the Joule heat generated due to the current flow across the solid matrix, and the last term is the
corresponding value for current flow in the electrolyte. Additional complexities, such as heat transfer
due to differential phase changes, radiation effects, etc., can be treated by incorporating the amount of
∂ E
heat generated from such phenomena in Eq. (6.48). The term T j corrects the open circuit voltage
T ∂
for changes in entropy with temperature. Open circuit voltages measured at different temperatures
may be used to evaluate this term empirically. Changes in other properties such as the diffusivity or
conductivity with temperature are often approximated by the Arrhenius equation
E 1 1
Φ Φ = ref exp - a - (6.49)
RT T ref
where Φ may represent D , κ , D , etc., Φ represents the corresponding property measured at
ref
eff
ef f
s
the reference temperature (T ), and E is the activation energy.
a
ref
Figure 6.13 illustrates the change in battery performance with different degrees of convective
cooling during a 3C-rate discharge of a lithium-ion cell. For the adiabatic case, increase in the cell
temperature favors higher reaction rates and enhances transport within the electrolyte following
[Eq. (6.49)]. The model predicts that without a cooling system in place, the difference in cell