
Page 78 - Low Temperature Energy Systems with Applications of Renewable Energy
P. 78
Characteristics of low-temperature energy sources for heat pumps 67
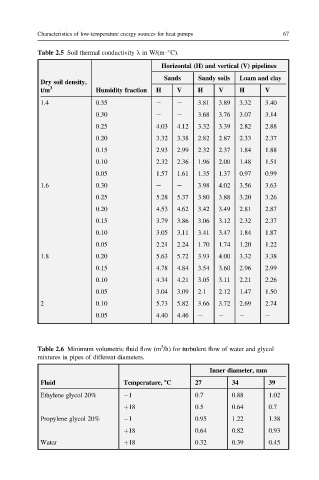
Table 2.5 Soil thermal conductivity l in W/(m$ C).
Horizontal (H) and vertical (V) pipelines
Sands Sandy soils Loam and clay
Dry soil density,
t/m 3 Humidity fraction H V H V H V
1.4 0.35 e e 3.81 3.89 3.32 3.40
0.30 e e 3.68 3.76 3.07 3.14
0.25 4.03 4.12 3.32 3.39 2.82 2.88
0.20 3.32 3.38 2.82 2.87 2.33 2.37
0.15 2.93 2.99 2.32 2.37 1.84 1.88
0.10 2.32 2.36 1.96 2.00 1.48 1.51
0.05 1.57 1.61 1.35 1.37 0.97 0.99
1.6 0.30 e e 3.98 4.02 3.56 3.63
0.25 5.28 5.37 3.80 3.88 3.20 3.26
0.20 4.53 4.62 3.42 3.49 2.81 2.87
0.15 3.79 3.86 3.06 3.12 2.32 2.37
0.10 3.05 3.11 3.41 3.47 1.84 1.87
0.05 2.21 2.24 1.70 1.74 1.20 1.22
1.8 0.20 5.63 5.72 3.93 4.00 3.32 3.38
0.15 4.78 4.84 3.54 3.60 2.96 2.99
0.10 4.34 4.21 3.05 3.11 2.21 2.26
0.05 3.04 3.09 2.1 2.12 1.47 1.50
2 0.10 5.73 5.82 3.66 3.72 2.69 2.74
0.05 4.40 4.46 e e e e
3
Table 2.6 Minimum volumetric fluid flow (m /h) for turbulent flow of water and glycol
mixtures in pipes of different diameters.
Inner diameter, mm
Fluid Temperature, 8C 27 34 39
Ethylene glycol 20% 1 0.7 0.88 1.02
þ18 0.5 0.64 0.7
Propylene glycol 20% 1 0.95 1.22 1.38
þ18 0.64 0.82 0.93
Water þ18 0.32 0.39 0.45