
Page 79 - MATLAB an introduction with applications
P. 79
64 ——— MATLAB: An Introduction with Applications
8
6
4
2
0
10 –6 10 –4 10 –2 10 –0
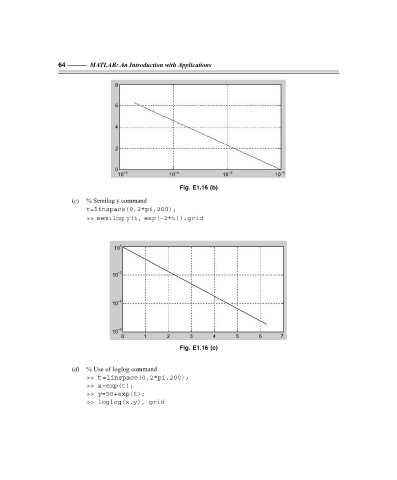
Fig. E1.16 (b)
(c) % Semilog y command
t=linspace(0,2*pi,200);
>> semilog y(t, exp(–2*t)),grid
10 0
–2
10
–4
10
–6
10
0 1 2 3 4 5 6 7
Fig. E1.16 (c)
(d) % Use of loglog command
>> t=linspace(0,2*pi,200);
>> x=exp(t);
>> y=50+exp(t);
>> loglog(x,y), grid
F:\Final Book\Sanjay\IIIrd Printout\Dt. 10-03-09