
Page 140 - MATLAB Recipes for Earth Sciences
P. 140
134 6 Signal Processing
6.8 Frequency Response
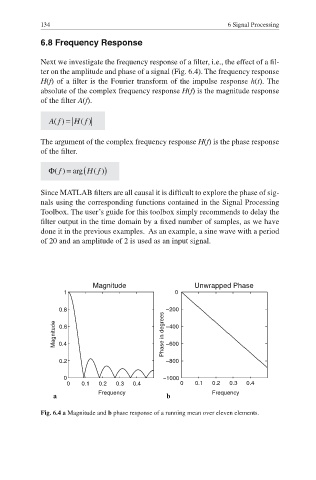
Next we investigate the frequency response of a filter, i.e., the effect of a fi l-
ter on the amplitude and phase of a signal (Fig. 6.4). The frequency response
H(f) of a filter is the Fourier transform of the impulse response h(t). The
absolute of the complex frequency response H(f) is the magnitude response
of the fi lter A(f).
The argument of the complex frequency response H(f) is the phase response
of the fi lter.
Since MATLAB filters are all causal it is difficult to explore the phase of sig-
nals using the corresponding functions contained in the Signal Processing
Toolbox. The user·s guide for this toolbox simply recommends to delay the
filter output in the time domain by a fixed number of samples, as we have
done it in the previous examples. As an example, a sine wave with a period
of 20 and an amplitude of 2 is used as an input signal.
Magnitude Unwrapped Phase
1 0
0.8 −200
Magnitude 0.6 Phase in degrees −400
−600
0.4
0.2 −800
0 −1000
0 0.1 0.2 0.3 0.4 0 0.1 0.2 0.3 0.4
Frequency Frequency
a b
Fig. 6.4 a Magnitude and b phase response of a running mean over eleven elements.