
Page 61 - MATLAB Recipes for Earth Sciences
P. 61
52 3 Univariate Statistics
α of a test is the maximum probability of accidentally rejecting a true null
hypothesis. Note that we cannot prove the null hypothesis, in other words
not guilty is not the same as innocent (Fig. 3.12).
The t–test can be performed by the function ttest2. We load an example
data set of two independent series of measurements. The first example shows
the performance of the t–test on two distributions with with the means 25.5
and 25.3, respectively, whereas the standard deviations are 1.3 and 1.5.
clear
load('organicmatter_two.mat');
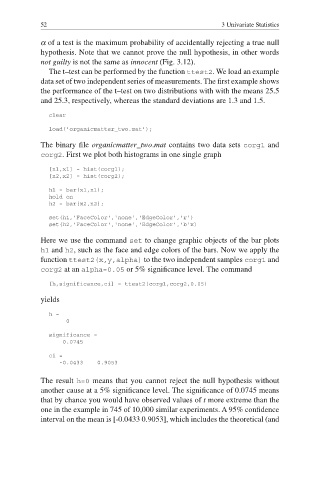
The binary fi le organicmatter_two.mat contains two data sets corg1 and
corg2. First we plot both histograms in one single graph
[n1,x1] = hist(corg1);
[n2,x2] = hist(corg2);
h1 = bar(x1,n1);
hold on
h2 = bar(x2,n2);
set(h1,'FaceColor','none','EdgeColor','r')
set(h2,'FaceColor','none','EdgeColor','b'x)
Here we use the command set to change graphic objects of the bar plots
h1 and h2, such as the face and edge colors of the bars. Now we apply the
function ttest2(x,y,alpha) to the two independent samples corg1 and
corg2 at an alpha=0.05 or 5% significance level. The command
[h,significance,ci] = ttest2(corg1,corg2,0.05)
yields
h =
0
significance =
0.0745
ci =
-0.0433 0.9053
The result h=0 means that you cannot reject the null hypothesis without
another cause at a 5% signifi cance level. The signifi cance of 0.0745 means
that by chance you would have observed values of t more extreme than the
one in the example in 745 of 10,000 similar experiments. A 95% confi dence
interval on the mean is [-0.0433 0.9053], which includes the theoretical (and