Page 351 -
P. 351

X-Ray–Based Fabrication                                                                    5-13


                                 TABLE 5.4 Properties of PMMA (nom. at 20°C)

                                 E – bulk modulus                            3.0 GPa
                                 G – shear modulus                           1.7 GPa
                                 ν – Poisson’s ratio                          0.40
                                                                                  –5
                                 α – linear thermal coefficient of expansion   7(10) /°C
                                    Water absorption (by wt. %)
                                           (during immersion)
                                    – 24 hrs.                                0.2%
                                    – 7 days                                 0.5%
                                    – 21 days                                0.8%
                                    – 48 days                                1.1%
                                    Glass transition temperature            105°C
                                 σ – tensile strength                       70 Mpa
                                  Y
                                 δ – density                                 1.19g/cc
                                 κ – thermal conductivity                    0.193 W/m 
 K
                                    Heat capacity                            1.42 J/g 
 K
                                 n – refractive index at 365 nm, 1014nm      1.514, 1.483
                                    Abbe number                                      58.0
                                 ε – dielectric constant
                                 r
                                   – 60 Hz                                   3.5
                                   – 1kHz                                    3.0
                                   – 1MHz                                    2.6
                                   – 30GHz                                    2.57


                                         4       8      12    16     20
                               0.5                                         Plate
                                                                           thickness (µm)

                               0.4
                              Plate buckling strain (%)   0.3


                               0.2


                               0.1


                                 0
                                  0          100        200        300        400         500
                                                      PMMA plate height (µm)

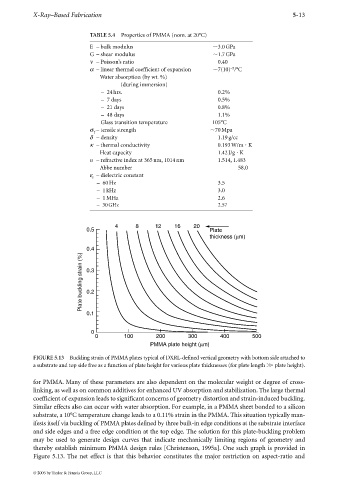
             FIGURE 5.13 Buckling strain of PMMA plates typical of DXRL-defined vertical geometry with bottom side attached to
             a substrate and top side free as a function of plate height for various plate thicknesses (for plate length    plate height).

             for PMMA. Many of these parameters are also dependent on the molecular weight or degree of cross-
             linking, as well as on common additives for enhanced UV absorption and stabilization. The large thermal
             coefficient of expansion leads to significant concerns of geometry distortion and strain-induced buckling.
             Similar effects also can occur with water absorption. For example, in a PMMA sheet bonded to a silicon
             substrate, a 10°C temperature change leads to a 0.11% strain in the PMMA. This situation typically man-
             ifests itself via buckling of PMMA plates defined by three built-in edge conditions at the substrate interface
             and side edges and a free edge condition at the top edge. The solution for this plate-buckling problem
             may  be  used  to  generate  design  curves  that  indicate  mechanically  limiting  regions  of geometry  and
             thereby establish minimum PMMA design rules [Christenson, 1995a]. One such graph is provided in
             Figure 5.13. The net effect is that this behavior constitutes the major restriction on aspect-ratio and


             © 2006 by Taylor & Francis Group, LLC
   346   347   348   349   350   351   352   353   354   355   356