
Page 88 -
P. 88
MEMS Fabrication 3-43
HF (49.23%)
90 10
80 20
HC H O Diluent
2 3 2
H O Diluent
2
70 30
60 40
190
50 50
40 60
30 70
38
20 80
Composition in weight %
10 90
Etch rates in µm / min 7.6
90 80 70 60 50 40 30 20 10
Diluent HNO (69.51%)
3
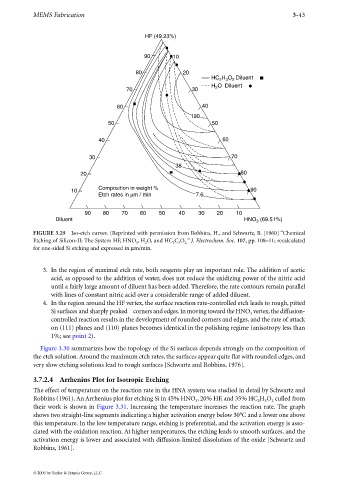
FIGURE 3.29 Iso-etch curves. (Reprinted with permission from Robbins, H., and Schwartz, B. [1960] “Chemical
Etching of Silicon-II: The System HF, HNO , H O, and HC C O ” J. Electrochem. Soc. 107, pp. 108–11; recalculated
3 2 2 3 2,
for one-sided Si etching and expressed in µm/min.
3. In the region of maximal etch rate, both reagents play an important role. The addition of acetic
acid, as opposed to the addition of water, does not reduce the oxidizing power of the nitric acid
until a fairly large amount of diluent has been added. Therefore, the rate contours remain parallel
with lines of constant nitric acid over a considerable range of added diluent.
4. In the region around the HF vertex, the surface reaction rate-controlled etch leads to rough, pitted
Si surfaces and sharply peaked corners and edges.In moving toward the HNO vertex,the diffusion-
3
controlled reaction results in the development of rounded corners and edges, and the rate of attack
on (111) planes and (110) planes becomes identical in the polishing regime (anisotropy less than
1%; see point 2).
Figure 3.30 summarizes how the topology of the Si surfaces depends strongly on the composition of
the etch solution. Around the maximum etch rates, the surfaces appear quite flat with rounded edges, and
very slow etching solutions lead to rough surfaces [Schwartz and Robbins, 1976].
3.7.2.4 Arrhenius Plot for Isotropic Etching
The effect of temperature on the reaction rate in the HNA system was studied in detail by Schwartz and
Robbins (1961). An Arrhenius plot for etching Si in 45% HNO , 20% HF, and 35% HC H O culled from
3 2 3 2
their work is shown in Figure 3.31.Increasing the temperature increases the reaction rate. The graph
shows two straight-line segments indicating a higher activation energy below 30°C and a lower one above
this temperature. In the low temperature range, etching is preferential, and the activation energy is asso-
ciated with the oxidation reaction. At higher temperatures, the etching leads to smooth surfaces, and the
activation energy is lower and associated with diffusion-limited dissolution of the oxide [Schwartz and
Robbins, 1961].
© 2006 by Taylor & Francis Group, LLC