
Page 56 -
P. 56
28 Diagnosing bias and variance: Learning
curves
We’ve seen some ways to estimate how much error can be attributed to avoidable bias vs.
variance. We did so by estimating the optimal error rate and computing the algorithm’s
training set and dev set errors. Let’s discuss a technique that is even more informative:
plotting a learning curve.
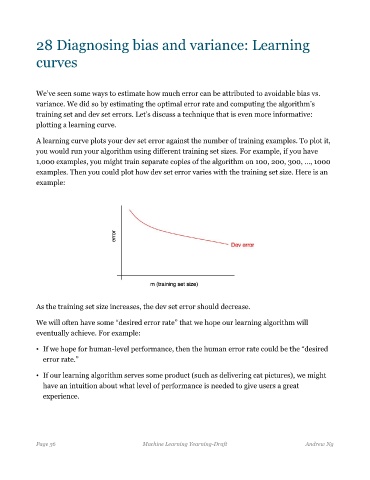
A learning curve plots your dev set error against the number of training examples. To plot it,
you would run your algorithm using different training set sizes. For example, if you have
1,000 examples, you might train separate copies of the algorithm on 100, 200, 300, …, 1000
examples. Then you could plot how dev set error varies with the training set size. Here is an
example:
As the training set size increases, the dev set error should decrease.
We will often have some “desired error rate” that we hope our learning algorithm will
eventually achieve. For example:
• If we hope for human-level performance, then the human error rate could be the “desired
error rate.”
• If our learning algorithm serves some product (such as delivering cat pictures), we might
have an intuition about what level of performance is needed to give users a great
experience.
Page 56 Machine Learning Yearning-Draft Andrew Ng