
Page 59 -
P. 59
29 Plotting training error
Your dev set (and test set) error should decrease as the training set size grows. But your
training set error usually increases as the training set size grows.
Let’s illustrate this effect with an example. Suppose your training set has only 2 examples:
One cat image and one non-cat image. Then it is easy for the learning algorithms to
“memorize” both examples in the training set, and get 0% training set error. Even if either or
both of the training examples were mislabeled, it is still easy for the algorithm to memorize
both labels.
Now suppose your training set has 100 examples. Perhaps even a few examples are
mislabeled, or ambiguous—some images are very blurry, so even humans cannot tell if there
is a cat. Perhaps the learning algorithm can still “memorize” most or all of the training set,
but it is now harder to obtain 100% accuracy. By increasing the training set from 2 to 100
examples, you will find that the training set accuracy will drop slightly.
Finally, suppose your training set has 10,000 examples. In this case, it becomes even harder
for the algorithm to perfectly fit all 10,000 examples, especially if some are ambiguous or
mislabeled. Thus, your learning algorithm will do even worse on this training set.
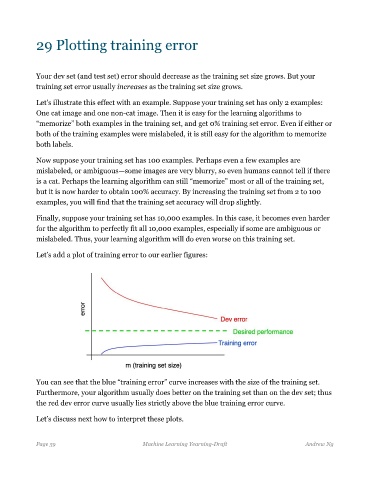
Let’s add a plot of training error to our earlier figures:
You can see that the blue “training error” curve increases with the size of the training set.
Furthermore, your algorithm usually does better on the training set than on the dev set; thus
the red dev error curve usually lies strictly above the blue training error curve.
Let’s discuss next how to interpret these plots.
Page 59 Machine Learning Yearning-Draft Andrew Ng