
Page 68 - Machine Learning for Subsurface Characterization
P. 68
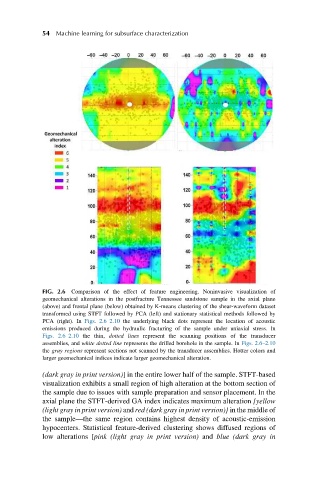
54  Machine learning for subsurface characterization


            FIG. 2.6 Comparison of the effect of feature engineering. Noninvasive visualization of
            geomechanical alterations in the postfracture Tennessee sandstone sample in the axial plane
            (above) and frontal plane (below) obtained by K-means clustering of the shear-waveform dataset
            transformed using STFT followed by PCA (left) and stationary statistical methods followed by
            PCA (right). In Figs. 2.6–2.10 the underlying black dots represent the location of acoustic
            emissions produced during the hydraulic fracturing of the sample under uniaxial stress. In
            Figs. 2.6–2.10 the thin, dotted lines represent the scanning positions of the transducer
            assemblies, and white dotted line represents the drilled borehole in the sample. In Figs. 2.6–2.10
            the gray regions represent sections not scanned by the transducer assemblies. Hotter colors and
            larger geomechanical indices indicate larger geomechanical alteration.

            (dark gray in print version)] in the entire lower half of the sample. STFT-based
            visualization exhibits a small region of high alteration at the bottom section of
            the sample due to issues with sample preparation and sensor placement. In the
            axial plane the STFT-derived GA index indicates maximum alteration [yellow
            (light gray in print version) and red (dark gray in print version)] in the middle of
            the sample—the same region contains highest density of acoustic-emission
            hypocenters. Statistical feature-derived clustering shows diffused regions of
            low alterations [pink (light gray in print version) and blue (dark gray in