
Page 69 - Machine Learning for Subsurface Characterization
P. 69
Characterization of fracture-induced geomechanical alterations Chapter 2 55
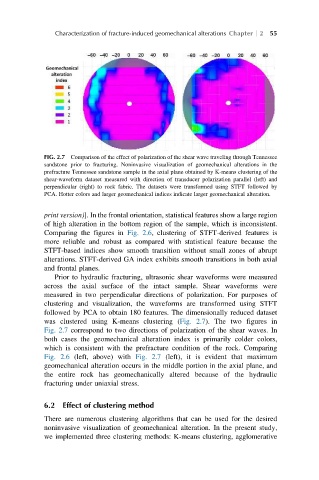
FIG. 2.7 Comparison of the effect of polarization of the shear wave traveling through Tennessee
sandstone prior to fracturing. Noninvasive visualization of geomechanical alterations in the
prefracture Tennessee sandstone sample in the axial plane obtained by K-means clustering of the
shear-waveform dataset measured with direction of transducer polarization parallel (left) and
perpendicular (right) to rock fabric. The datasets were transformed using STFT followed by
PCA. Hotter colors and larger geomechanical indices indicate larger geomechanical alteration.
print version)]. In the frontal orientation, statistical features show a large region
of high alteration in the bottom region of the sample, which is inconsistent.
Comparing the figures in Fig. 2.6, clustering of STFT-derived features is
more reliable and robust as compared with statistical feature because the
STFT-based indices show smooth transition without small zones of abrupt
alterations. STFT-derived GA index exhibits smooth transitions in both axial
and frontal planes.
Prior to hydraulic fracturing, ultrasonic shear waveforms were measured
across the axial surface of the intact sample. Shear waveforms were
measured in two perpendicular directions of polarization. For purposes of
clustering and visualization, the waveforms are transformed using STFT
followed by PCA to obtain 180 features. The dimensionally reduced dataset
was clustered using K-means clustering (Fig. 2.7). The two figures in
Fig. 2.7 correspond to two directions of polarization of the shear waves. In
both cases the geomechanical alteration index is primarily colder colors,
which is consistent with the prefracture condition of the rock. Comparing
Fig. 2.6 (left, above) with Fig. 2.7 (left), it is evident that maximum
geomechanical alteration occurs in the middle portion in the axial plane, and
the entire rock has geomechanically altered because of the hydraulic
fracturing under uniaxial stress.
6.2 Effect of clustering method
There are numerous clustering algorithms that can be used for the desired
noninvasive visualization of geomechanical alteration. In the present study,
we implemented three clustering methods: K-means clustering, agglomerative