
Page 74 - Machine Learning for Subsurface Characterization
P. 74
60 Machine learning for subsurface characterization
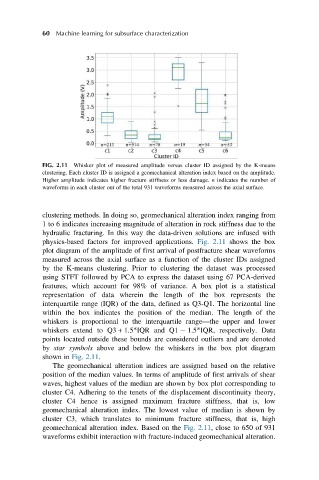
FIG. 2.11 Whisker plot of measured amplitude versus cluster ID assigned by the K-means
clustering. Each cluster ID is assigned a geomechanical alteration index based on the amplitude.
Higher amplitude indicates higher fracture stiffness or less damage. n indicates the number of
waveforms in each cluster out of the total 931 waveforms measured across the axial surface.
clustering methods. In doing so, geomechanical alteration index ranging from
1 to 6 indicates increasing magnitude of alteration in rock stiffness due to the
hydraulic fracturing. In this way the data-driven solutions are infused with
physics-based factors for improved applications. Fig. 2.11 shows the box
plot diagram of the amplitude of first arrival of postfracture shear waveforms
measured across the axial surface as a function of the cluster IDs assigned
by the K-means clustering. Prior to clustering the dataset was processed
using STFT followed by PCA to express the dataset using 67 PCA-derived
features, which account for 98% of variance. A box plot is a statistical
representation of data wherein the length of the box represents the
interquartile range (IQR) of the data, defined as Q3-Q1. The horizontal line
within the box indicates the position of the median. The length of the
whiskers is proportional to the interquartile range—the upper and lower
whiskers extend to Q3 + 1.5*IQR and Q1 1.5*IQR, respectively. Data
points located outside these bounds are considered outliers and are denoted
by star symbols above and below the whiskers in the box plot diagram
shown in Fig. 2.11.
The geomechanical alteration indices are assigned based on the relative
position of the median values. In terms of amplitude of first arrivals of shear
waves, highest values of the median are shown by box plot corresponding to
cluster C4. Adhering to the tenets of the displacement discontinuity theory,
cluster C4 hence is assigned maximum fracture stiffness, that is, low
geomechanical alteration index. The lowest value of median is shown by
cluster C3, which translates to minimum fracture stiffness, that is, high
geomechanical alteration index. Based on the Fig. 2.11, close to 650 of 931
waveforms exhibit interaction with fracture-induced geomechanical alteration.