
Page 70 - Machine Learning for Subsurface Characterization
P. 70
56 Machine learning for subsurface characterization
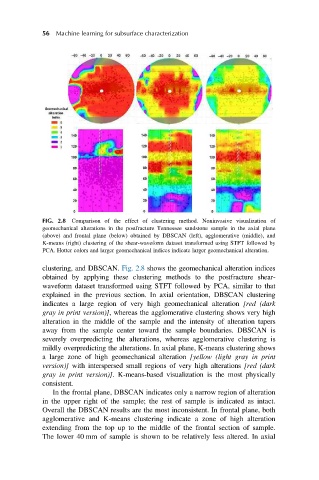
FIG. 2.8 Comparison of the effect of clustering method. Noninvasive visualization of
geomechanical alterations in the postfracture Tennessee sandstone sample in the axial plane
(above) and frontal plane (below) obtained by DBSCAN (left), agglomerative (middle), and
K-means (right) clustering of the shear-waveform dataset transformed using STFT followed by
PCA. Hotter colors and larger geomechanical indices indicate larger geomechanical alteration.
clustering, and DBSCAN. Fig. 2.8 shows the geomechanical alteration indices
obtained by applying these clustering methods to the postfracture shear-
waveform dataset transformed using STFT followed by PCA, similar to that
explained in the previous section. In axial orientation, DBSCAN clustering
indicates a large region of very high geomechanical alteration [red (dark
gray in print version)], whereas the agglomerative clustering shows very high
alteration in the middle of the sample and the intensity of alteration tapers
away from the sample center toward the sample boundaries. DBSCAN is
severely overpredicting the alterations, whereas agglomerative clustering is
mildly overpredicting the alterations. In axial plane, K-means clustering shows
a large zone of high geomechanical alteration [yellow (light gray in print
version)] with interspersed small regions of very high alterations [red (dark
gray in print version)]. K-means-based visualization is the most physically
consistent.
In the frontal plane, DBSCAN indicates only a narrow region of alteration
in the upper right of the sample; the rest of sample is indicated as intact.
Overall the DBSCAN results are the most inconsistent. In frontal plane, both
agglomerative and K-means clustering indicate a zone of high alteration
extending from the top up to the middle of the frontal section of sample.
The lower 40 mm of sample is shown to be relatively less altered. In axial