
Page 75 - Machine Learning for Subsurface Characterization
P. 75
Characterization of fracture-induced geomechanical alterations Chapter 2 61
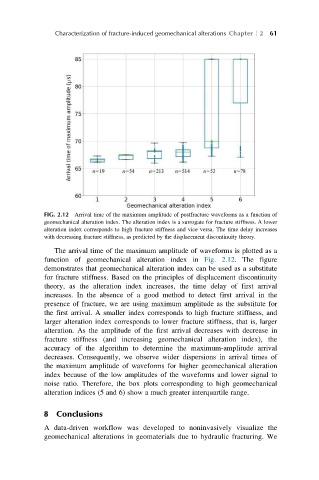
FIG. 2.12 Arrival time of the maximum amplitude of postfracture waveforms as a function of
geomechanical alteration index. The alteration index is a surrogate for fracture stiffness. A lower
alteration index corresponds to high fracture stiffness and vice versa. The time delay increases
with decreasing fracture stiffness, as predicted by the displacement discontinuity theory.
The arrival time of the maximum amplitude of waveforms is plotted as a
function of geomechanical alteration index in Fig. 2.12. The figure
demonstrates that geomechanical alteration index can be used as a substitute
for fracture stiffness. Based on the principles of displacement discontinuity
theory, as the alteration index increases, the time delay of first arrival
increases. In the absence of a good method to detect first arrival in the
presence of fracture, we are using maximum amplitude as the substitute for
the first arrival. A smaller index corresponds to high fracture stiffness, and
larger alteration index corresponds to lower fracture stiffness, that is, larger
alteration. As the amplitude of the first arrival decreases with decrease in
fracture stiffness (and increasing geomechanical alteration index), the
accuracy of the algorithm to determine the maximum-amplitude arrival
decreases. Consequently, we observe wider dispersions in arrival times of
the maximum amplitude of waveforms for higher geomechanical alteration
index because of the low amplitudes of the waveforms and lower signal to
noise ratio. Therefore, the box plots corresponding to high geomechanical
alteration indices (5 and 6) show a much greater interquartile range.
8 Conclusions
A data-driven workflow was developed to noninvasively visualize the
geomechanical alterations in geomaterials due to hydraulic fracturing. We