
Page 71 - Machine Learning for Subsurface Characterization
P. 71
Characterization of fracture-induced geomechanical alterations Chapter 2 57
plane, the geomechanical alteration indices generated using agglomerative
clustering, as compared with the K-means, have better correlation with the
density of acoustic-emission hypocenter. However, K-means generates much
better visualization in the front plane that coincides with the acoustic-
emission hypocenters. Overall, in comparison with agglomerative clustering,
K-means indicates a smaller region of very high alteration in axial and
frontal planes and generates more consistent visualization.
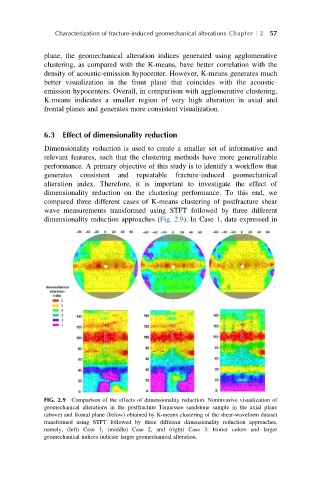
6.3 Effect of dimensionality reduction
Dimensionality reduction is used to create a smaller set of informative and
relevant features, such that the clustering methods have more generalizable
performance. A primary objective of this study is to identify a workflow that
generates consistent and repeatable fracture-induced geomechanical
alteration index. Therefore, it is important to investigate the effect of
dimensionality reduction on the clustering performance. To this end, we
compared three different cases of K-means clustering of postfracture shear
wave measurements transformed using STFT followed by three different
dimensionality reduction approaches (Fig. 2.9). In Case 1, data expressed in
FIG. 2.9 Comparison of the effects of dimensionality reduction. Noninvasive visualization of
geomechanical alterations in the postfracture Tennessee sandstone sample in the axial plane
(above) and frontal plane (below) obtained by K-means clustering of the shear-waveform dataset
transformed using STFT followed by three different dimensionality reduction approaches,
namely, (left) Case 1, (middle) Case 2, and (right) Case 3. Hotter colors and larger
geomechanical indices indicate larger geomechanical alteration.