
Page 37 - Machinery Component Maintenance
P. 37
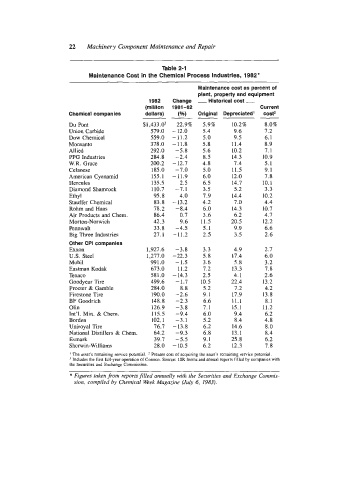
22   Machinery  Component Maintenance and Repair


                                                  Table 2-1
                            Maintenance Cost in the Chemical Process Industries, 1982’
                                                             Maintenance cost as percent of
                                                             plant, property and equipment
                                              1982    Change  - Historical cost -
                                             (million   1981-82                 Current
                                                             Original  Depreciated’
                                                       (%)
                                             dollars)
                      Chemical companies    --                                   cost2
                      Du Pont                $1,433.03   22.9%   5.9%   10.2%     8.0%
                      Union Carbidc            579.0   -12.0   s .4     9.6       7.2
                      Dow Chemical             559.0  -11.2    5  .O    9.5       6.1
                      Monsanto                 378.0   -11.8   5.8      11.4      8.9
                      Allied                   292.0   -5.8    5.6      10.2      7.1
                      PPG Industries           284.8   -2.4    8.5      14.3     10.9
                      W.R. Grace               200.2   -12.7   4.8      7.4       5.1
                      Celanese                 185.0   -7.0    5  .O    11.5      9.1
                      American Cyanamid        155.1  -11.9    6.0      12.0      7.8
                      Hcrcules                 135.5    2.5    6.5      14.7     10.1
                      Diamond Shamrock         110.7   -7.1    3.5      5.2       3.3
                      Ethyl                     95.8    4.0    7.9      14.4     10.2
                      Stauffer Chemical         83.8   -13.2   4.2      7.0       4.4
                      Rohm and Haas             78.2   -8.4    6.0      14.3     10.7
                      Air Products and Chem.    86.4    0.7    3.6      6.2       4.7
                      Morton-Norwich            42.3    9.6   11.5     20.5      12.2
                      Pennwalt                  33.8   -4.5    5.1      9.9       6.6
                      Big Three Industries      27.1   -11.2   2.5      3.5       2.6
                      Other CPI companies
                      Exxon                   1,927.6   -3.8   3.3      4.9       2.7
                      U.S.  Steel             1,277.0  -22.3   5.8      17.4      6.0
                      Mobil                    991.0   -1.5    3.6      5.8       3.2
                      Eastman Kodak            673.0   11.2    7.2      13.3      7.8
                      Texaco                   581.0   -14.3   2.5      4.1       2.6
                      Goodyear Tire            499.6   -1.7   10.5      22.4     13.2
                      Procter & Gamble         284.0    8.8    5.2      7.2       4.2
                      Firestone Tire           190.0   -2.6    9.1      17.9     13.8
                      BF Goodrich              148.8   -2.3    6.6      11.1      8.1
                      Olin                     126.9   -3.8    7.1      15.1     11.2
                      Int’l.  Min.  & Chem.    115.5   -9.4    6.0      9.4       6.2
                      Borden                   102.1   -3.1    5.2      8.4       4.8
                      Uniroyal Tire             76.7   -13.8   6.2      14.6      8.0
                      National Distillers & Chem.   64.2   -9.3   6.8   13.1      8.4
                      Esmark                    39.7   -5.5    9.1      25.8      6.2
                      Sherwin-Williams          28.0   -10.5   6.2      12.3      7.8
                      I The asset’s remaining sewice potential.  Present cost of acquiring the asset’s remaining service potential.
                       Includes the first full-year operation of Conoco. Source: 10K forms and annual reports filled by  companies with
                      the Securities and Exchange Commission.
                      * Figures taken ffom reports filled annually with the Securities and Exchange Commis-
                        sion, compiled by  Chemical  Week Magazine  (July 6, 1983).