
Page 62 - Macromolecular Crystallography
P. 62
AU TOMATION OF CRYS TALLIZATION TECHNIQUES 51
the membrane into the lower channel; when the quality crystals (Protocol 3.4). Such a diagram deter-
pressure is removed the membrane springs open. mines at which conditions the protein precipitates,
Each trial uses 10 nl of protein sample and 144 at which the solution remains clear, and where crys-
trials are performed at a time. This device has tals form (Fig. 3.3). This information can then be
produced diffracting crystals in volumes of 5 to used to determine the appropriate conditions for
20 nl, including new crystals that were not detected separating the phases of nucleation and growth.
by other crystallization methods. A chip for per- Workingphasediagramscanbegeneratedmanually,
forming larger numbers of trials has recently been
devised.
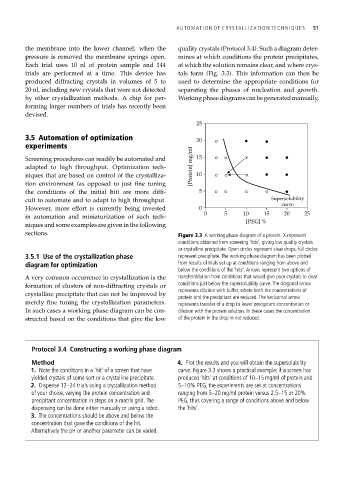
25
3.5 Automation of optimization 20
experiments
Screening procedures can readily be automated and 15
adapted to high throughput. Optimization tech- [Protein] mg/ml
niques that are based on control of the crystalliza- 10
tion environment (as opposed to just fine tuning
the conditions of the initial hit) are more diffi- 5
cult to automate and to adapt to high throughput. Supersolubility
curve
However, more effort is currently being invested 0
0 5 10 15 20 25
in automation and miniaturization of such tech-
[PEG] %
niques and some examples are given in the following
sections. Figure 3.3 A working phase diagram of a protein. X represent
conditions obtained from screening ‘hits’, giving low quality crystals
or crystalline precipitate. Open circles represent clear drops; full circles
3.5.1 Use of the crystallization phase represent precipitate. The working phase diagram has been plotted
diagram for optimization from results of trials set up at conditions ranging from above and
below the conditions of the ‘hits’. Arrows represent two options of
A very common occurrence in crystallization is the transfer/dilution from conditions that would give poor crystals to clear
formation of clusters of non-diffracting crystals or conditions just below the supersolubility curve. The diagonal arrow
represents dilution with buffer, where both the concentrations of
crystalline precipitate that can not be improved by
protein and the precipitant are reduced. The horizontal arrow
merely fine tuning the crystallization parameters. represents transfer of a drop to lower precipitant concentration or
In such cases a working phase diagram can be con- dilution with the protein solution. In these cases the concentration
structed based on the conditions that give the low of the protein in the drop in not reduced.
Protocol 3.4 Constructing a working phase diagram
Method 4. Plot the results and you will obtain the supersolubility
1. Note the conditions in a ‘hit’ of a screen that have curve. Figure 3.3 shows a practical example: if a screen has
yielded crystals of some sort or a crystalline precipitate. produced ‘hits’ at conditions of 10–15 mg/ml of protein and
2. Dispense 12–24 trials using a crystallization method 5–10% PEG, the experiments are set at concentrations
of your choice, varying the protein concentration and ranging from 5–20 mg/ml protein versus 2.5–15 or 20%
precipitant concentration in steps on a matrix grid. The PEG, thus covering a range of conditions above and below
dispensing can be done either manually or using a robot. the ‘hits’.
3. The concentrations should be above and below the
concentration that gave the conditions of the hit.
Alternatively the pH or another parameter can be varied.