
Page 57 - Macromolecular Crystallography
P. 57
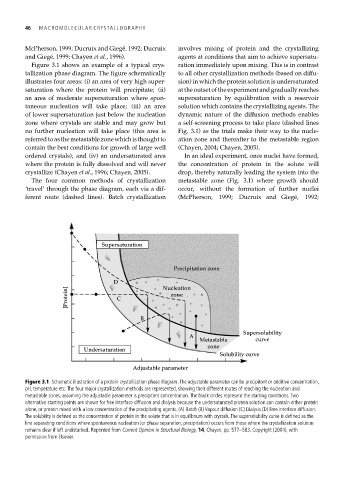
46  MACROMOLECULAR CRYS TALLOGRAPHY

        McPherson, 1999; Ducruix and Giegé, 1992; Ducruix  involves mixing of protein and the crystallizing
        and Giegé, 1999; Chayen et al., 1996).       agents at conditions that aim to achieve supersatu-
          Figure 3.1 shows an example of a typical crys-  ration immediately upon mixing. This is in contrast
        tallization phase diagram. The figure schematically  to all other crystallization methods (based on diffu-
        illustrates four areas: (i) an area of very high super-  sion) in which the protein solution is undersaturated
        saturation where the protein will precipitate; (ii)  at the outset of the experiment and gradually reaches
        an area of moderate supersaturation where spon-  supersaturation by equilibration with a reservoir
        taneous nucleation will take place; (iii) an area  solution which contains the crystallizing agents. The
        of lower supersaturation just below the nucleation  dynamic nature of the diffusion methods enables
        zone where crystals are stable and may grow but  a self-screening process to take place (dashed lines
        no further nucleation will take place (this area is  Fig. 3.1) as the trials make their way to the nucle-
        referredtoasthemetastablezonewhichisthoughtto  ation zone and thereafter to the metastable region
        contain the best conditions for growth of large well  (Chayen, 2004; Chayen, 2005).
        ordered crystals); and (iv) an undersaturated area  In an ideal experiment, once nuclei have formed,
        where the protein is fully dissolved and will never  the concentration of protein in the solute will
        crystallize (Chayen et al., 1996; Chayen, 2005).  drop, thereby naturally leading the system into the
          The four common methods of crystallization  metastable zone (Fig. 3.1) where growth should
        ‘travel’ through the phase diagram, each via a dif-  occur, without the formation of further nuclei
        ferent route (dashed lines). Batch crystallization  (McPherson,  1999;  Ducruix and Giegé,  1992;


                               Supersaturation


                                                   Precipitation zone

                                  D             Nucleation
                    [Protein]      C               zone


                                          B

                                                                        Supersolubility
                                                        A
                                                           Metastable      curve
                                                             zone
                         Undersaturation
                                                                 Solubility curve
                                        Adjustable parameter

        Figure 3.1 Schematic illustration of a protein crystallization phase diagram. The adjustable parameter can be precipitant or additive concentration,
        pH, temperature etc. The four major crystallization methods are represented, showing their different routes of reaching the nucleation and
        metastable zones, assuming the adjustable parameter is precipitant concentration. The black circles represent the starting conditions. Two
        alternative starting points are shown for free interface diffusion and dialysis because the undersaturated protein solution can contain either protein
        alone, or protein mixed with a low concentration of the precipitating agents. (A) Batch (B) Vapour diffusion (C) Dialysis (D) Free interface diffusion.
        The solubility is defined as the concentration of protein in the solute that is in equilibrium with crystals. The supersolubility curve is defined as the
        line separating conditions where spontaneous nucleation (or phase separation, precipitation) occurs from those where the crystallization solution
        remains clear if left undisturbed. Reprinted from Current Opinion in Structural Biology, 14, Chayen, pp. 577–583, Copyright (2004), with
        permission from Elsevier.