
Page 503 -
P. 503
502 Part Three Key System Applications for the Digital Age
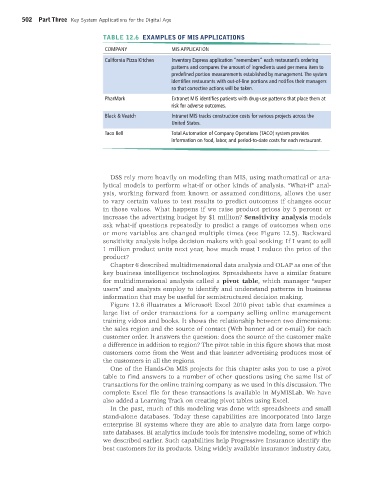
TABLE 12.6 EXAMPLES OF MIS APPLICATIONS
COMPANY MIS APPLICATION
California Pizza Kitchen Inventory Express application “remembers” each restaurant’s ordering
patterns and compares the amount of ingredients used per menu item to
predefined portion measurements established by management. The system
identifies restaurants with out-of-line portions and notifies their managers
so that corrective actions will be taken.
PharMark Extranet MIS identifies patients with drug-use patterns that place them at
risk for adverse outcomes.
Black & Veatch Intranet MIS tracks construction costs for various projects across the
United States.
Taco Bell Total Automation of Company Operations (TACO) system provides
information on food, labor, and period-to-date costs for each restaurant.
DSS rely more heavily on modeling than MIS, using mathematical or ana-
lytical models to perform what-if or other kinds of analysis. “What-if” anal-
ysis, working forward from known or assumed conditions, allows the user
to vary certain values to test results to predict outcomes if changes occur
in those values. What happens if we raise product prices by 5 percent or
increase the advertising budget by $1 million? Sensitivity analysis models
ask what-if questions repeatedly to predict a range of outcomes when one
or more variables are changed multiple times (see Figure 12.5). Backward
sensitivity analysis helps decision makers with goal seeking: If I want to sell
1 million product units next year, how much must I reduce the price of the
product?
Chapter 6 described multidimensional data analysis and OLAP as one of the
key business intelligence technologies. Spreadsheets have a similar feature
for multidimensional analysis called a pivot table, which manager “super
users” and analysts employ to identify and understand patterns in business
information that may be useful for semistructured decision making.
Figure 12.6 illustrates a Microsoft Excel 2010 pivot table that examines a
large list of order transactions for a company selling online management
training videos and books. It shows the relationship between two dimensions:
the sales region and the source of contact (Web banner ad or e-mail) for each
customer order. It answers the question: does the source of the customer make
a difference in addition to region? The pivot table in this figure shows that most
customers come from the West and that banner advertising produces most of
the customers in all the regions.
One of the Hands-On MIS projects for this chapter asks you to use a pivot
table to find answers to a number of other questions using the same list of
transactions for the online training company as we used in this discussion. The
complete Excel file for these transactions is available in MyMISLab. We have
also added a Learning Track on creating pivot tables using Excel.
In the past, much of this modeling was done with spreadsheets and small
stand-alone databases. Today these capabilities are incorporated into large
enterprise BI systems where they are able to analyze data from large corpo-
rate databases. BI analytics include tools for intensive modeling, some of which
we described earlier. Such capabilities help Progressive Insurance identify the
best customers for its products. Using widely available insurance industry data,
MIS_13_Ch_12 global.indd 502 1/17/2013 2:30:32 PM